During the month of January, I travelled back to the roots of where I came from. It was quite a fascinating journey to look back at what I was and to never forget to remember how simple our lives will be, ashes to ashes, dust to dust. Both we and the economy have been trying hard to enhance the quality of life; however, in the end, everything will just return to ashes and dust. It tells me that, in this most crucial year, I should always remember who I was and increase my awareness to avoid getting caught up in a tempted blow-off rally at the end of it.
There are many different factors that affect financial pricing, but I will be focusing on a few.
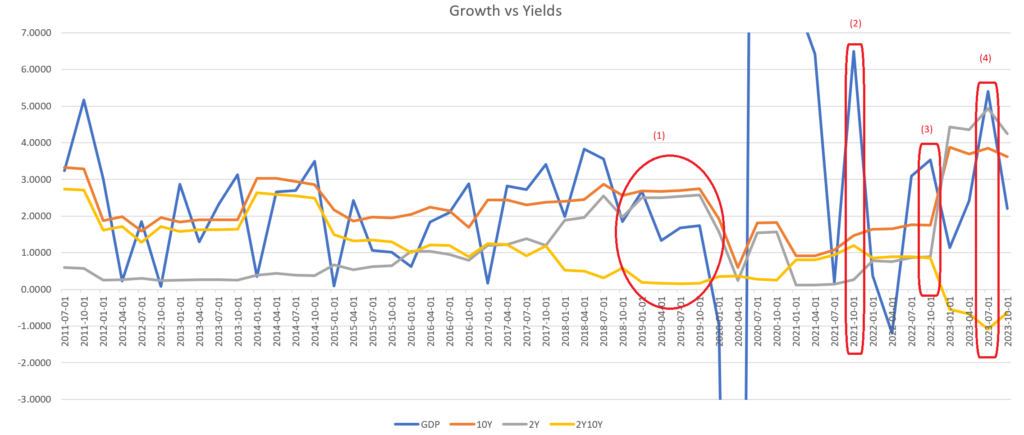
- GDP growth
- Incentive to invest = 2Y10Y
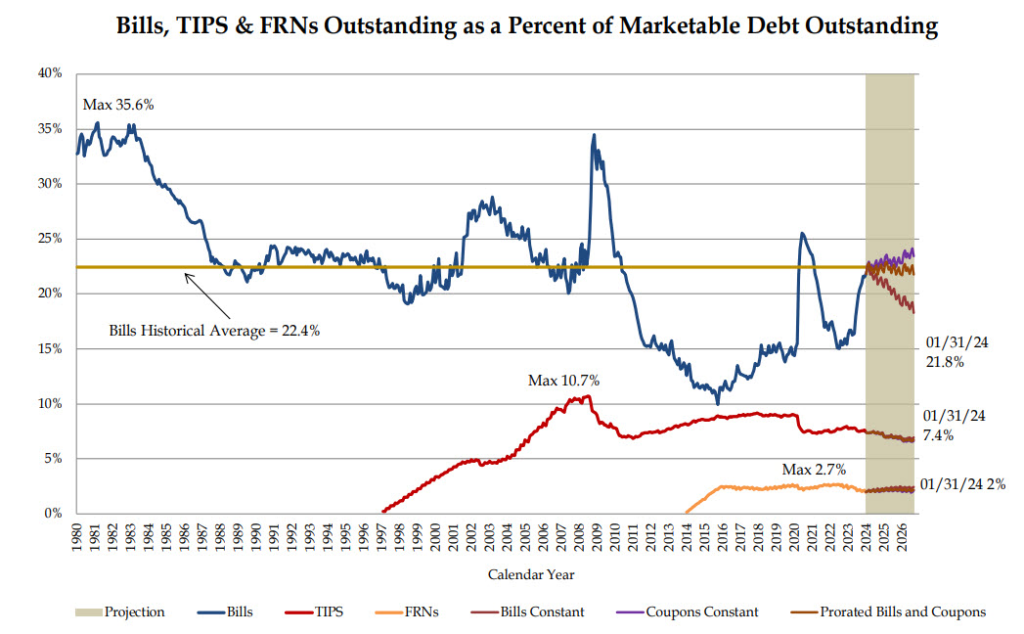
- The Bill
- Inflation proxy = 10Y
- DXY
Policy makers have, so far, been attempting to balance market conditions with their policies most of the time.
- The spread between 2-year and 10-year yields, or the inversion, has been deteriorating since 2015. This indicates that there has been diminishing incentive for financial institutions to invest in long-term assets, leading to a greater focus on short-term deleveraging. As a result, the average duration of investments keeps getting shorter. The Treasury has also had to issue more bills and reduce pressure on bonds. It’s quite remarkable that this situation has been able to persist for more than 8 years, largely due to factors related to money or liquidity.
- Case #1: In September 2019, there was a cash shortage, and short-term yields were increasing, indicating a potential liquidity shortage in the short-term market. GDP was deteriorating, and the spread was near zero. I believe that in this situation, the investment engine was underperforming, and yields were too high relative to GDP growth, leading to a spike in the SOFR (Secured Overnight Financing Rate) from 2.43% to 5.25%. The situation worsened when the GDP fell below zero in 2020, signaling the start of a recession.
- Since 2020, the amount of liquidity injected into the system has been very significant, larger than at any point in history. As a result, there has been an abundant amount of liquidity concentrated in the short-term market.
- Case #2: Around July 2021, GDP was very volatile due to the massive easing measures implemented in 2020. I believe this volatility was part of the concept of being transitory, which included inflation. By October 2021, the Federal Reserve should have increased interest rates, especially since the NASDAQ 100 (QQQ) had reached significantly higher levels, but they waited until the GDP figures hit their lowest point in March 2022. As a result, their response was too late. Inflation had risen sharply, and the Federal Reserve had to rapidly increase rates, leading to a significant decline in risky assets.
- Case #3: In October 2022, GDP indicated strong rebounds and sufficient liquidity, with a peak in the Reverse Repurchase Agreement (RRP) operations. Even though the spread was diverging, the RRP and Bank Reserve helped support this situation. This assistance contributed to the rebound of the NASDAQ 100 (QQQ) in early January 2023. In this case, liquidity prevailed.
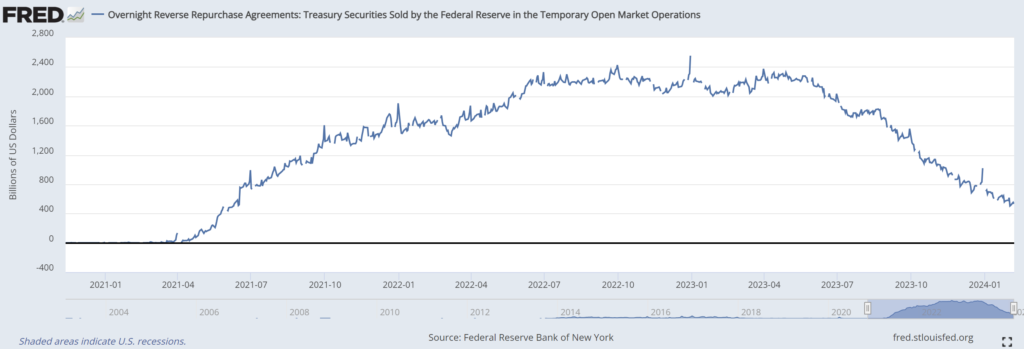
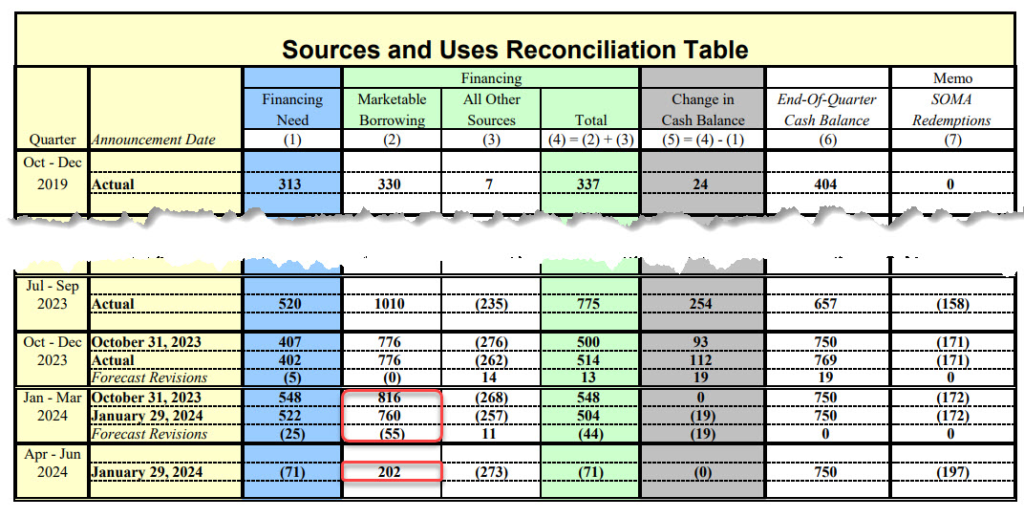
- Case #4: In July 2023, funds from the Reverse Repurchase Agreement (RRP) began flowing into the economy, and inflation expectations finally started to rebound, supporting my previous thesis that a 5.5% rate was inevitable. The spread is still much lower, meaning there is much less incentive to invest due to the high-end rate. This situation led to a change in policy in September 2023 with the Quantitative Restriction Adjustment (QRA), where policies now need to be more supportive to reduce pressure on the fragile long end of the market.
- Going forward, inflation, as indicated by the 10-year yield, remains persistently high. Because of this, the Federal Reserve remains cautious about lowering the front-end rate.
By examining some of the most important cases mentioned above, along with the most significant factors, I am attempting to study the behaviour of policymakers. By understanding their behaviour, I expect to identify some patterns that I can use to anticipate their next policies and their potential impacts.
Going forwards, we have reached a situation where both GDP and inflation should align, with reduced investment incentives. This scenario is becoming increasingly dependent on liquidity:
- RRP was previously expected to go zero in March
- Debt ceiling was previously expected to max 35T$ in June
- QT (Quantitative Tightening) was expected to taper
- Treasury profile supply allocation is expected to remain supportive
In my thesis, the Federal Reserve was unable to cut rates due to the Reverse Repurchase Agreement (RRP) and Bank Reserves, indicating that liquidity is still ample. With the Treasury General Account (TGA) potentially is now sufficient at 10% of GDP, it may be difficult for the RRP to drop to zero in March, especially with indicators such as the Quantitative Restriction Adjustment (QRA) may further reduced long-term issuance as indicated in much less issuance in the second quarter of 2024. I believe policymakers are now attempting to keep the hungover condition longer, potentially to the end of election in view. They may also intentionally delay the RRP from dropping to zero and to manage enough room of the debt ceiling, which should be approaching $35 trillion in June, by reducing the issuance of bills in the second quarter of 2024.
Given that inflation is expected to remain high, the only way at the moment to sustain an elevated stock market is by ensuring that GDP growth stays above the inflation rate. In my opinion, the very important mechanism to spur/maintain future growth must be through a rate cut. However, before proceeding with a rate cut, according to my thesis, the Federal Reserve would need to taper their Quantitative Tightening (QT) to avoid providing excessive support to a market rally.
- step 1. end of QT/taper, prior to:
- step 2. rate cut
- continuing long end support
While waiting for the rate cut, we may actually see the situation deteriorating further. Statistically, a rally may last for 6 months after the inversion reaches zero, potentially coinciding with the start of a rate cut which is now expected in May. However, prior to that, the risk of a deflationary blip is also normally very possible.
- long end yield, especially note might continue to indicate increasing inflation
- much less incentive to invest
- bigger inversion
- depleting liquidity
Policy makers are likely to use all available means within the existing liquidity framework to prevent further deterioration of the situation. For example, consider the recent successful largest 10-year Treasury auction, which may indicate ability to handle current inflation damage to financial. The second quarter of 2024 could be a crucial and interesting period to observe whether inflation continues to pose a threat. However, given recent developments and drama around CPI (Consumer Price Index), PPI (Producer Price Index), and CPE (Personal Consumption Expenditures), it seems that policy still tends towards avoiding a hard landing and hopefully remains supportive.
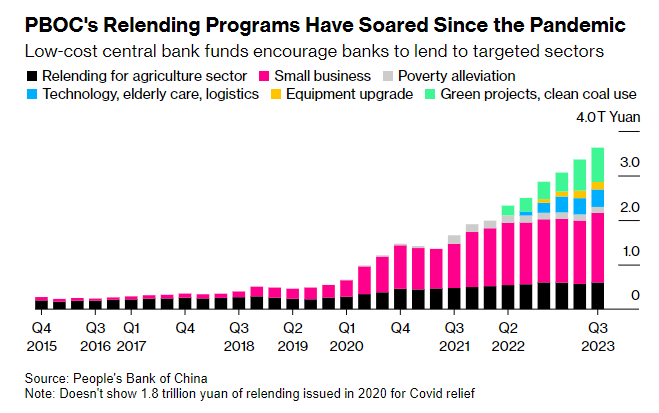
The question now is, where will the growth come from? My thesis continues to revolve around the lifting of restrictions, primarily in China. Since the COVID-19 pandemic in 2020, China has experienced rapid growth. Their focus is expected to remain on achieving high-quality growth, rather than relying on the property sector, which has been a major growth driver for decades. Although this shift presents significant challenges, and the scale of their high-growth sectors, despite impressive growth, is still far from replacing the decades of growth driven by real estate.
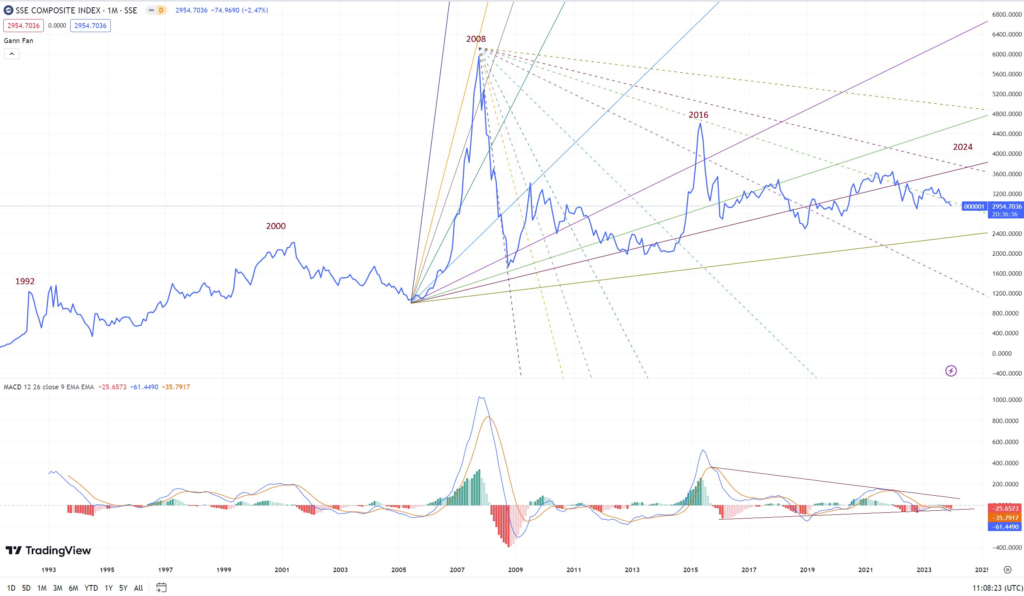
While the situation begins with a significant correction, there’s still a possibility that the Year of the Dragon will mark a rally in the Chinese market in 2024. However, this 8-year cycle could signify the end of a global rally. Implementing a large stimulus in China might not be an easy task, given the high cost associated with high front-end rates. In my thesis, the effectiveness of their easing efforts could be demonstrated by how much the DXY (US Dollar Index) can further soften from here. According to my theory, for this to occur, the demand for the USD must exceed the strength of the US economy itself. The stimulus is expensive until the rate/cost is lower.
Given the current market conditions, which are severe, the only factors that could support a rally are liquidity and the performance of the DXY (US Dollar Index). As a result, our strategy at the moment is still to align with the DXY while focusing on high-quality asset classes. I didn’t make any major changes to my portfolio, I only made adjustments based on the DXY in the first few weeks of January. Without significant easing measures in place yet, we will stick with the highest quality assets available and avoid any small(er) or even low quality shares. We are waiting for the right moment to implement our first action, which involves moving into Treasury bills, before executing our second action, shifting into Treasury bonds, in the longer term. In our view, the current situation is still quite precarious, and the economy is heavily dependent on policymakers. At this point, nothing else matters more than liquidity and fiscal monetary policy. In my opinion, the ability to cut rates remains the most critical factor, and for a rate cut to be feasible, lower inflation and a reduction in the yield on the 10-year Treasury are necessary. We believe that market makers will do everything within their power to support these objectives. Fingers crossed.

Please note that all ideas expressed in this blog and website are solely my personal opinions and should never be considered as financial advice.