Category Archives: Foreign exchange

Winter Inferno

In September 2024, I decided to start making a major overhaul of my investment strategy and outlook. Our Heavenly Father gave me two powerful pieces of music and song.

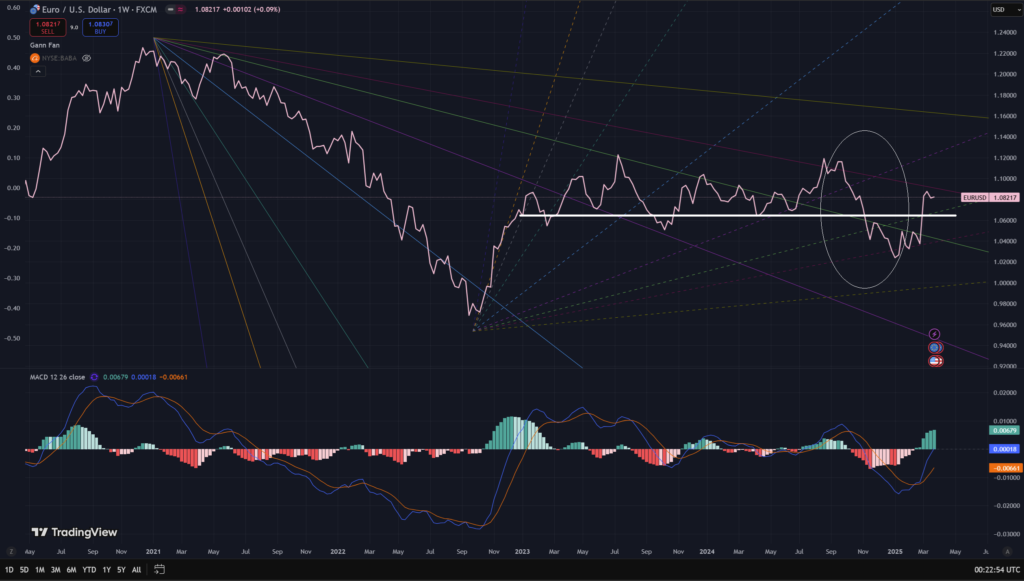
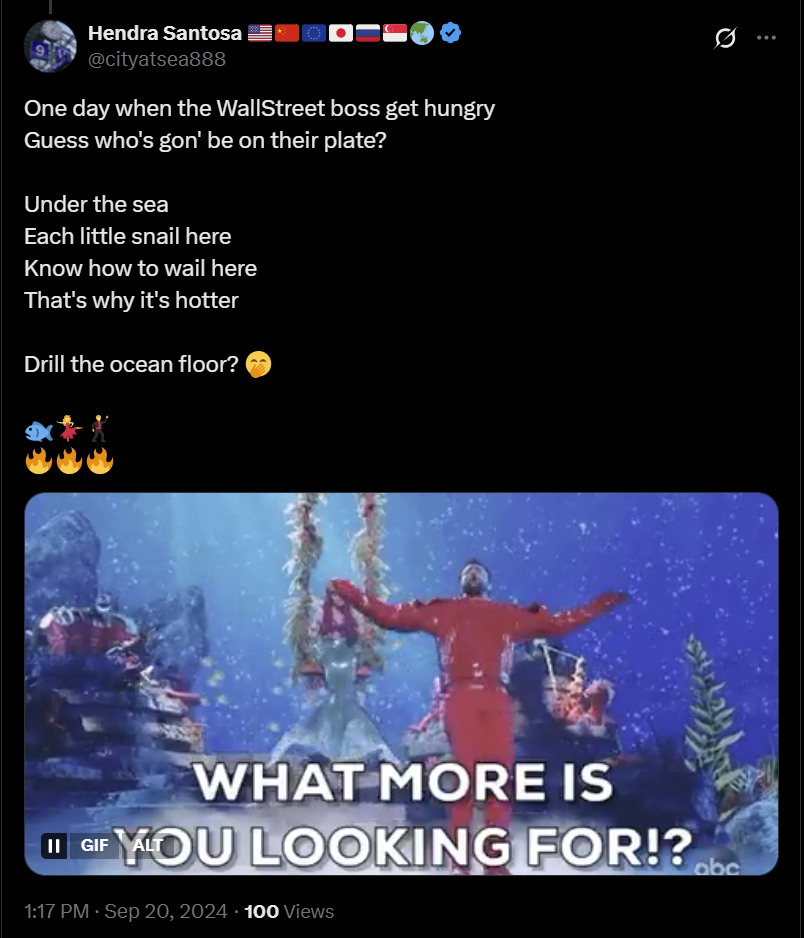
The first was the one I referenced in my “Whiter Shade of Pale” article. It’s a very famous song, deeply ingrained in my mind for decades since I was very young. The magic of this music, for me, lies in the simplicity of its C-major scale—moving from C to C and back again—symbolizing the major global investment shift I foresee that time. The song also tells a story about a time when I still believed that the EUR/USD exchange rate could hold steady, despite the very negative views prevailing at the time. Investors were anticipating a stronger USD, broken European systems, deteriorating economic indicators, and a parity target for Q4. My view, although delayed by a few months, was ultimately proven to be correct, despite massive EUR printing and not US.

After Japan reached its debt capacity, I believed Germany still had a relatively large debt-to-GDP ratio of 60%, compared to other major European countries and the US, which had a ratio of 120%. The music, with its haunting tones, conveyed to me the nuances of a dying corporate structure in the financial markets, even back in those days—”her face at first just ghostly, and then turned a whiter shade of pale.

The second piece of music that inspired me most during that time was Vivaldi’s L’Inferno. I’ve mentioned many times and consistently shared its basic views since.

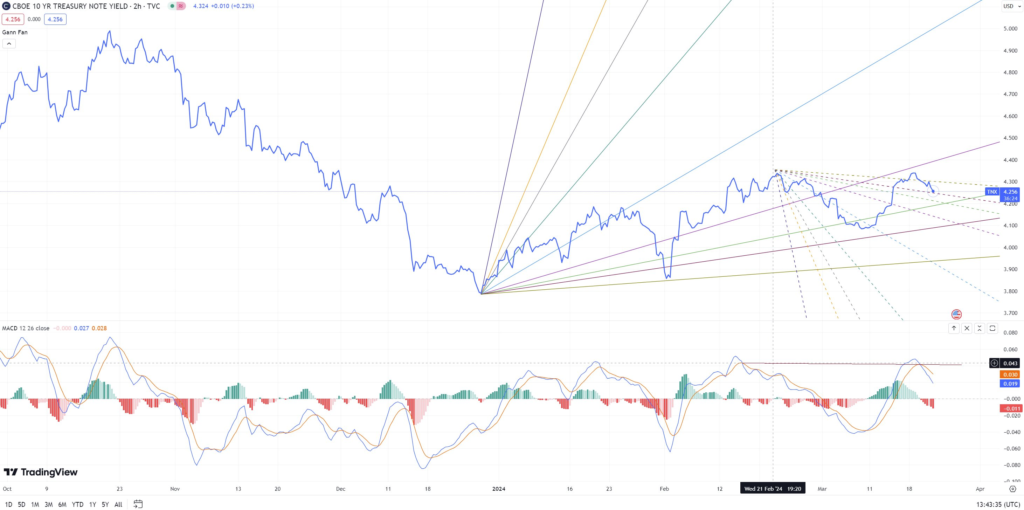
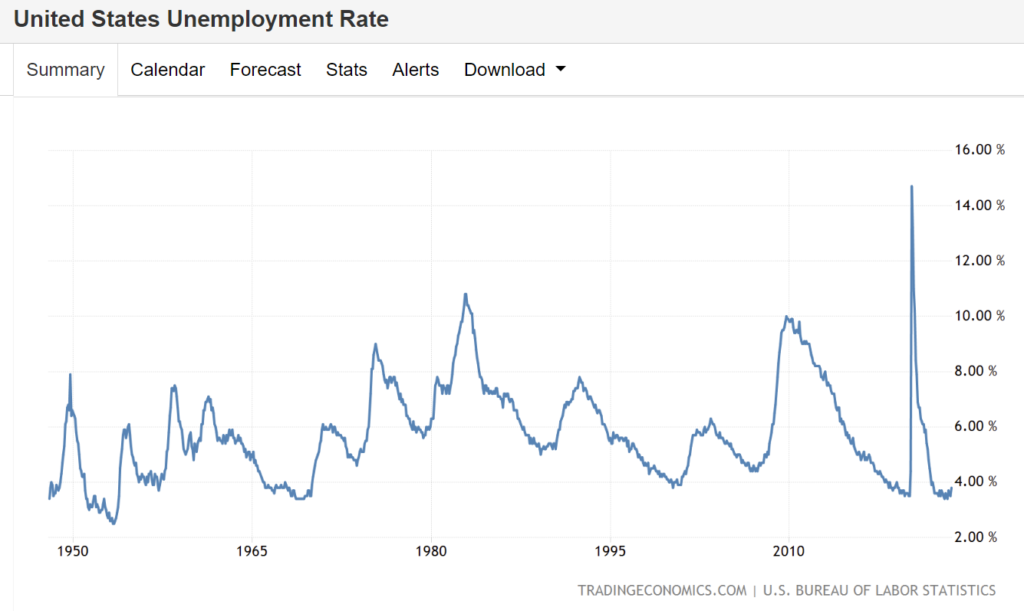
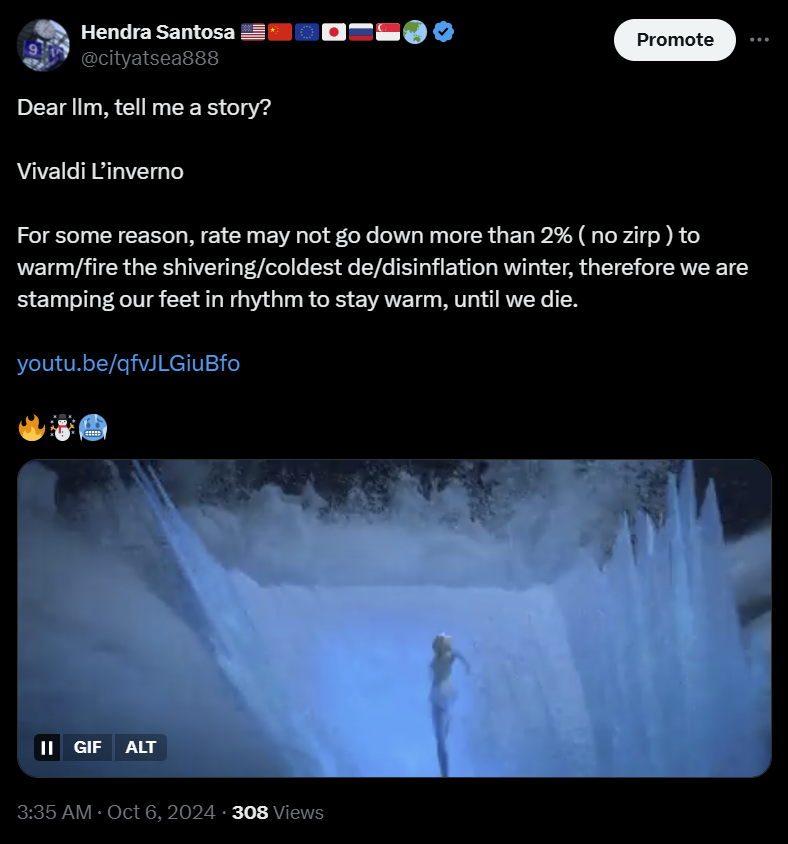
In October 2024, I posted: “For some reason, rates may not go down more than 2% (no ZIRP) to warm/fire the coldest de/disinflation winter; therefore, we are stamping our feet in rhythm to stay warm, until we die.” Based on my calculations, I didn’t believe the Fed’s rate cuts could easily go lower than 2% from 5.5%, or below 3.5%. This would mean we would experience a very cold, shivering disinflation (restrictive) winter, despite market expectations that inflation would remain high or even rebound. I couldn’t understand the market’s perspective at that time because, obviously, inflation was very high and in my numbers, very high likely to continue its decline over long months or years due to NOT related to the inflation itself, but due to mainly sticky high rate, thing that markets may mistakenly understand until today. I also didn’t understand why the market did recognize that the Fed was being very loose, while my view remains consistently restrictive or better said moderately restrictive. I repeatedly suggest looking at real businesses and customers rather than focusing solely on the less dirty shirt official numbers and policies, as these have widely long used, especially in EM, to led many economists to become delusional to read real issue from the consumers side.

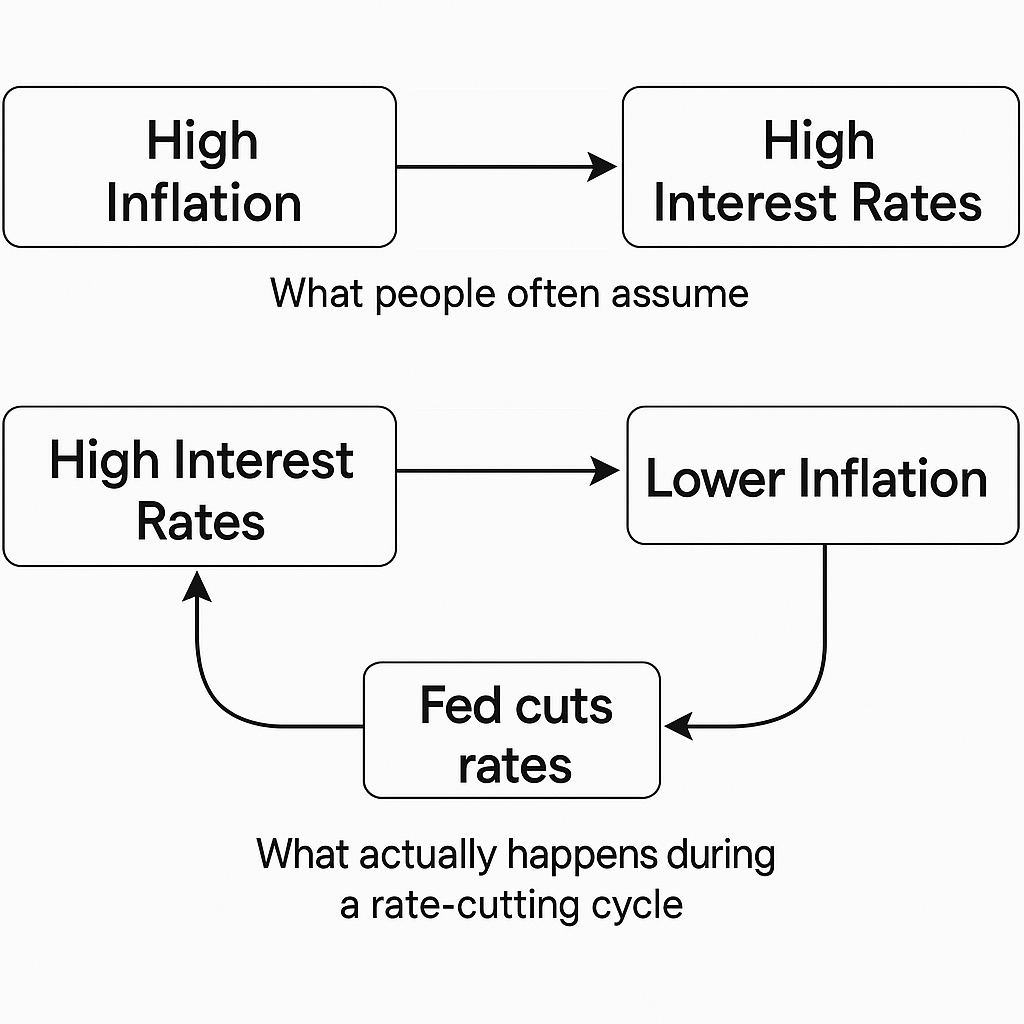
The reasoning behind persistently high rates is complex, but the most important aspect—forming the basis of my broader and my main idea of the Paradox thesis—is that the Fed will be unable to cut rates deeply because deep cuts is going to paradoxically absorb large amount of not so much left over undeployed short term liquidity. Again, in my view, this is not due to sticky inflation, but rather for the sake of financial liquidity stability, and in my thesis, this issue is mostly due to fiscal bailout during high inflation in 2022, which I will explain down below. Yes, I agree that inflation will be sticky high. In fact, based on my 2023 calculations, I think inflation should remain around 2.6% for a very long time. But that’s not the main point. This is the most critical aspect of the thesis and explains why markets will continue to misinterpret the bigger picture. Markets keep relying on economic literature solely to justify high rates based on sticky high inflation and that’s where they are wrong, while my principle uses a monetary perspective to justify the necessity of high rate to avoid short term liquidity shortening, in which from the monetary point of view is historically working much better, and also to explain the fiscal bailout in 2022.

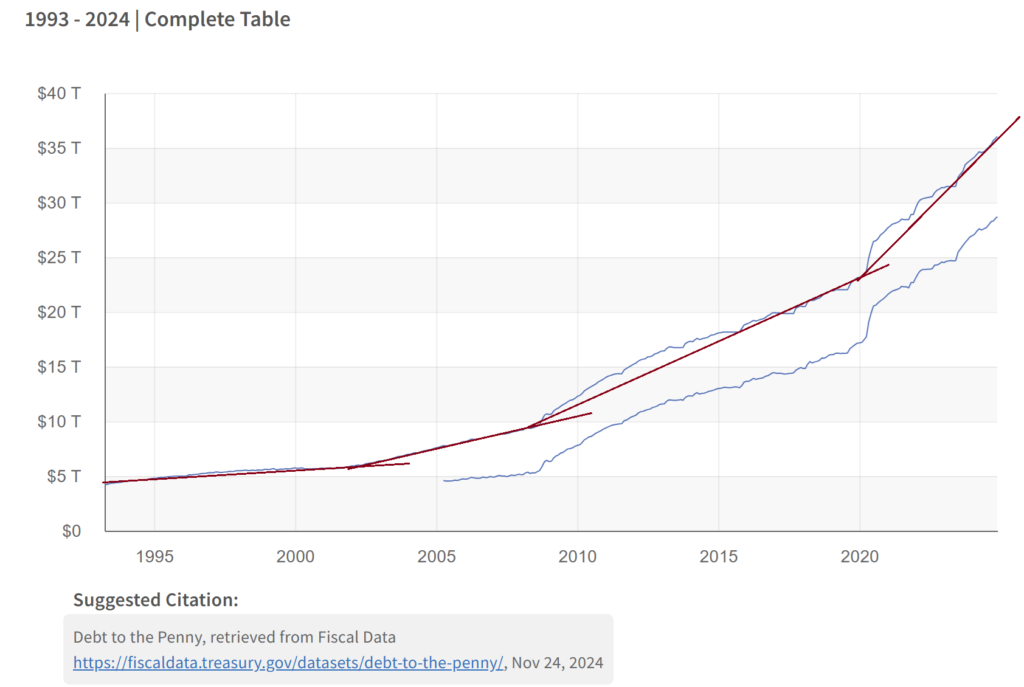
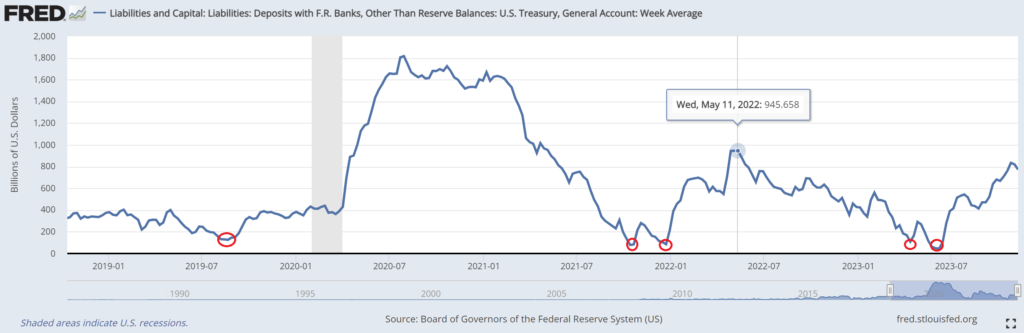
In 2022, the equilibrium of the financial system was corrupted. The financial system has long operated like a vehicle—requiring both a force (short term interests) and a brake (long term interests), yin and yang, expansion and correction/sanitation. However, due to the high inflation and rapid rate hikes at the time (due to excessive printing and expansion in 2020), policymakers removed/bailed out the braking mechanism (long-term profile) and bailed its pain out by shifting it into the force side via fiscal measures. Just look at the QRA, the Fed’s balance sheet, and their related policies. Yes I understand that Treasury should seek lowest cost available in the market, but that would also lead to more support to break the vehicle. The bailout can be explained with my delta theory from a few years back, where if funds are shifted into extremely short-term instruments, they become immune to high inflation, low inflation, and even deflation dynamics.

It’s obvious that avoiding the painful part of the cycle only postpones the problem—essentially kicking the can down the road. As a result, in 2023 and 2024, the system ran purely on force without brakes, leading to unsustainable fiscal debt and their interest payments dependency and the crazy run of the ‘Magnificent.’ This is the problem we face now, how to normalise the systems back?

We can’t just reintroduce the brake to equilibrium after deliberately avoiding the pain without another pain—it’s like a scene from Final Destination. I see only three possible solutions:

  1. A long-term approach of massive high-growth investments.
  2. A short-term approach of a massive bailout.
  3. Transferring the pain to another vehicle—most likely the ‘Magnificent.’

The first one is the best solution but it requires lots of hard work and time. The second one is the common solution to the crisis. Last but not the least, I really hope they don’t choose solely the last option because it would bring enormous pain to the Magnificent shareholders who jumped on this bandwagon since 2022 and still hold them at high price, because if they choose solely this solution, Magnificent may come back to 2022 or lower, which will drag down all other things into crisis. I think they may distribute among the three.

In my grand thesis, I have repeatedly referred to this as my two years of paradoxical winter inferno. In summary, this September thesis has been explaining well, the entire concept of real disinflation/lower growth, engineered sticky high financial inflation, and persistently high rates, based on liquidity dynamics above The rest of its strategy is just straightforward.

For me, it was clear: the rate would remain restrictive. Over the decades, the average return of US companies has been around 5%. In my view, if the Fed holds rates at 5%, it would likely result in 0% growth.

And this has proven to be true: to maintain financial liquidity stability, the central bank has found it difficult to bring rates below 4.3%. Be mindful of each word above—they carry significant meaning that markets consistently misunderstand. Surprisingly, if we re-read all central bank statements, they fully align with this, but readers keep interpret them incorrectly and showing disagreement with the central bank statements. The readers have simply misunderstood the statements and misinterpreted the situation.

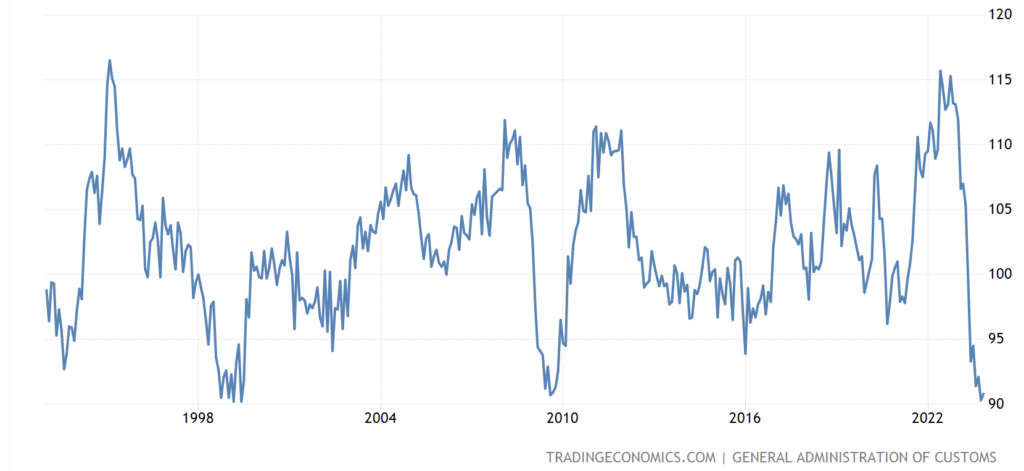
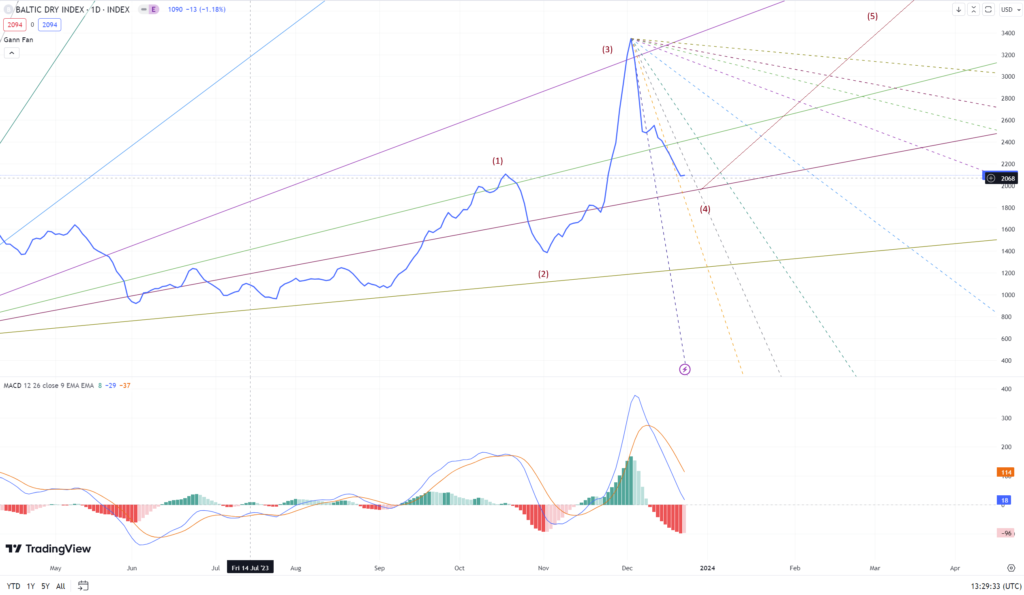
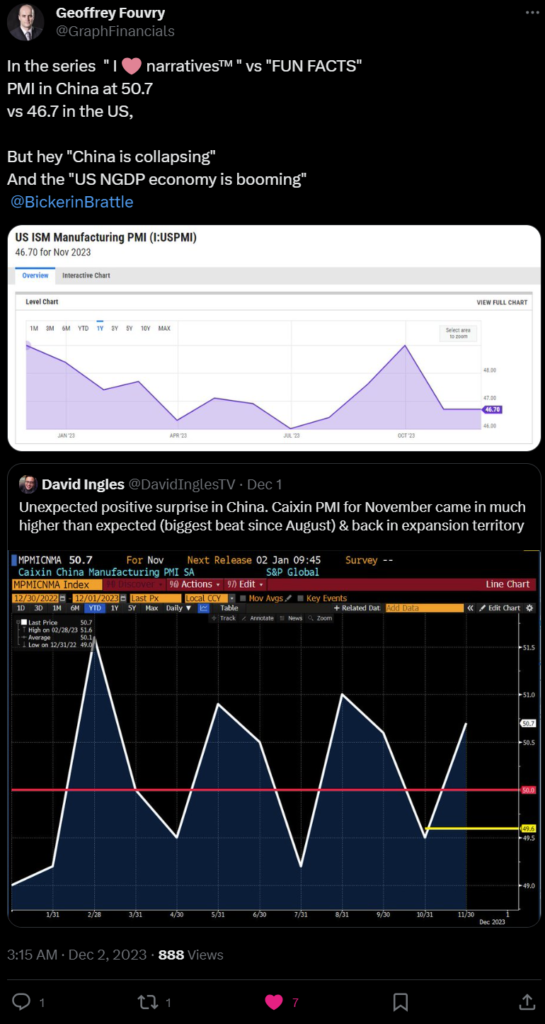
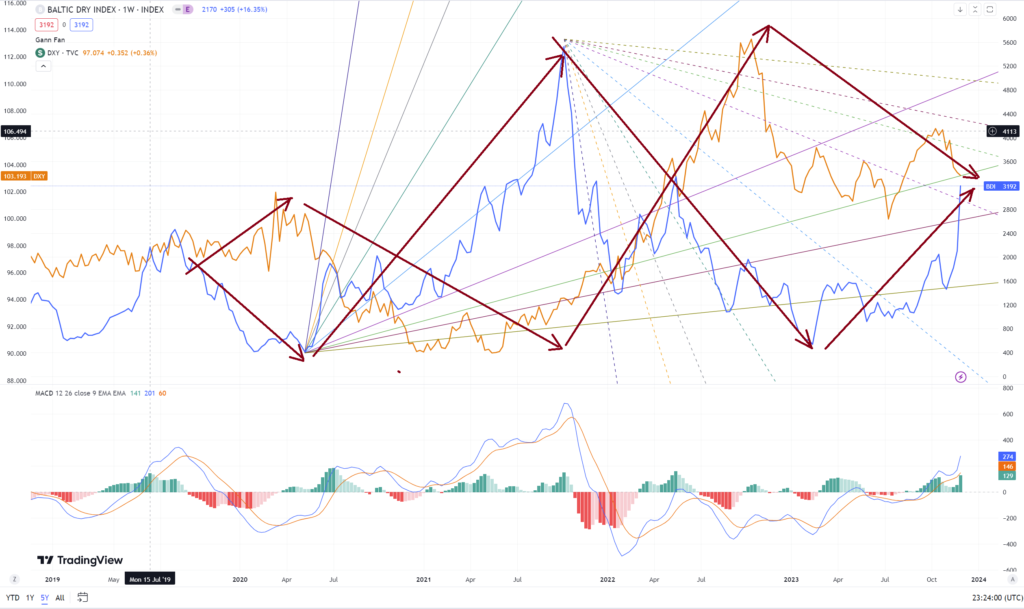
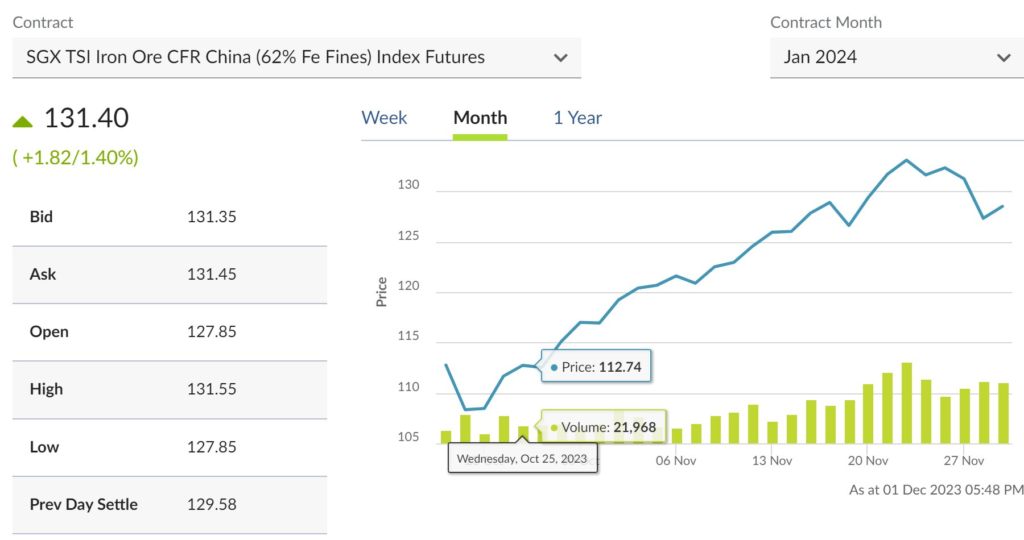
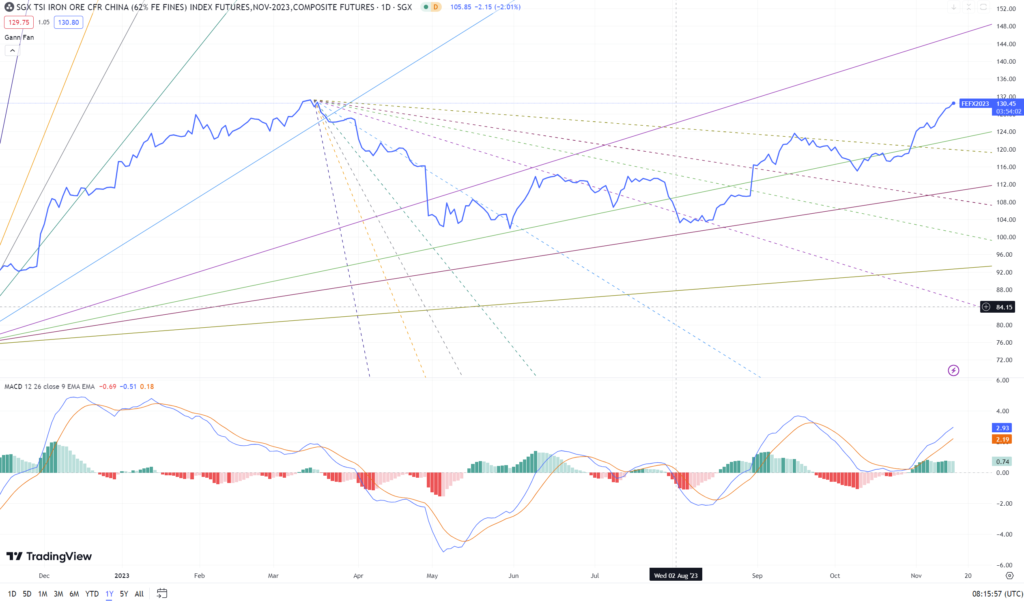
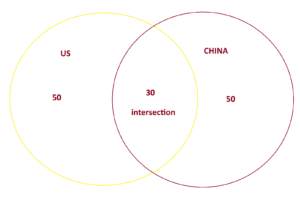
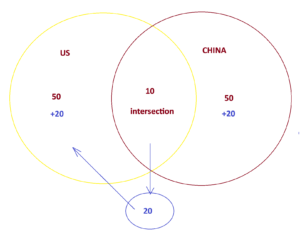
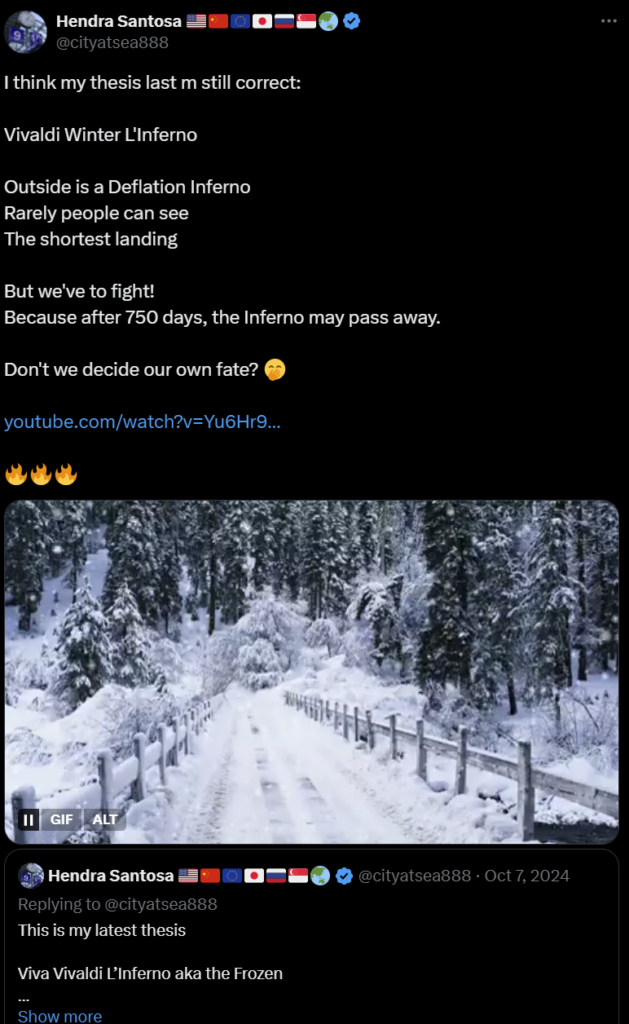
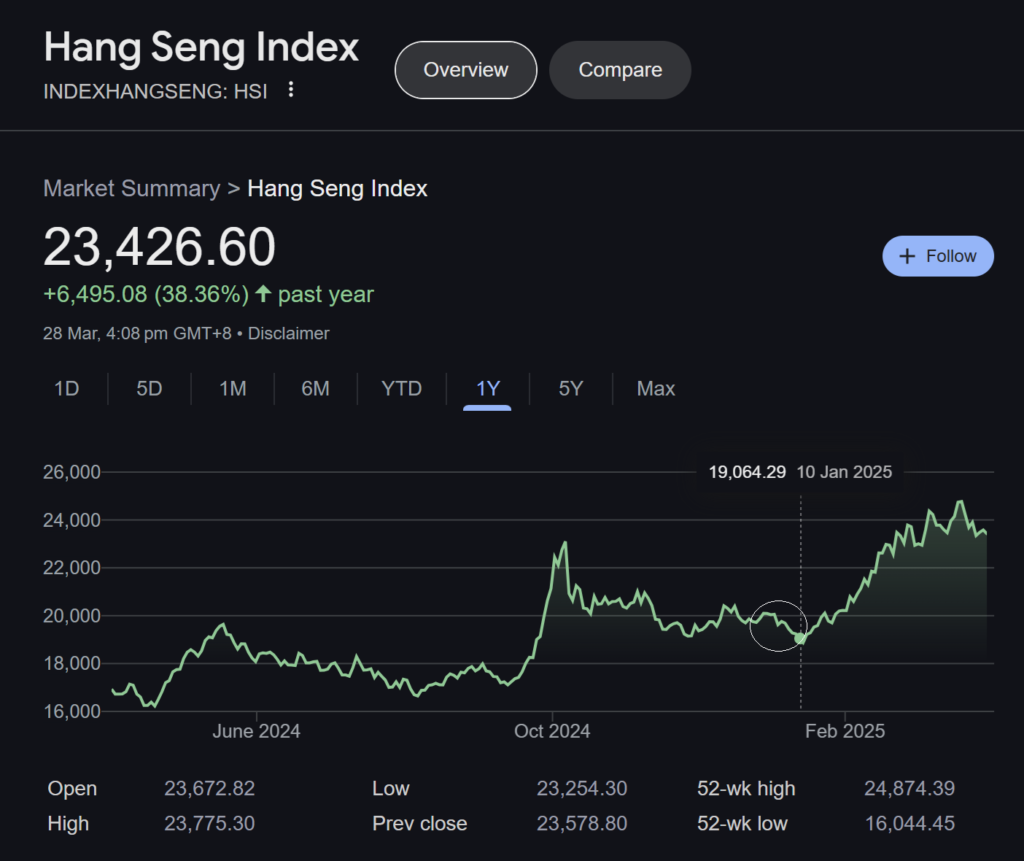
I further detailed the result of my computation, which indicated that this phase could last around 750 days, or roughly two years. In my expectation, after that, the winter inferno may pass. In my thesis, the easiest solution is a hard landing, but I leaned more towards the possibility of a FIGHT. We could then see China starting to take action, beginning in Q4, following by Europe in Q1, notice the fighting patterns? This would also lead to the application of my long-standing Emerging Market (EM) strategy and understanding, in which I believe China will continue to outperform since September.

I stuck to my China thesis, even as the markets grew skeptical after the small dips in November and December. I was determined to prove them wrong again—not just about their wrong China bullish stance in 2023 (while I was super bearish), but also their overly bearish stance in Q4 (while I’m super bullish) including their skepticism in November and December. Overall, everything remains on track and continues to align with my predictions. I simply raised a straightforward question: how long and how practical is their involvement in the EM markets? I bet many of them have neither experience nor exposure.

I normally make only a few changes per year and remain mostly stubborn with my thesis because I have numbers to support my reasoning. The decision, though made in September to November to exit them almost entirely with all of their high leverage and unable to capture the peak in January, is not disappointing to me because the market surged at the early of the year, only to obviously return to or drop below this October thesis call. It’s impossible to always catch the top, and in my experience, that’s unnecessary. The most important thing is the numbers or the reasoning behind the thesis, as that determines how aggressively we take on leverage, reduce it, or even go entirely to cash if necessary.

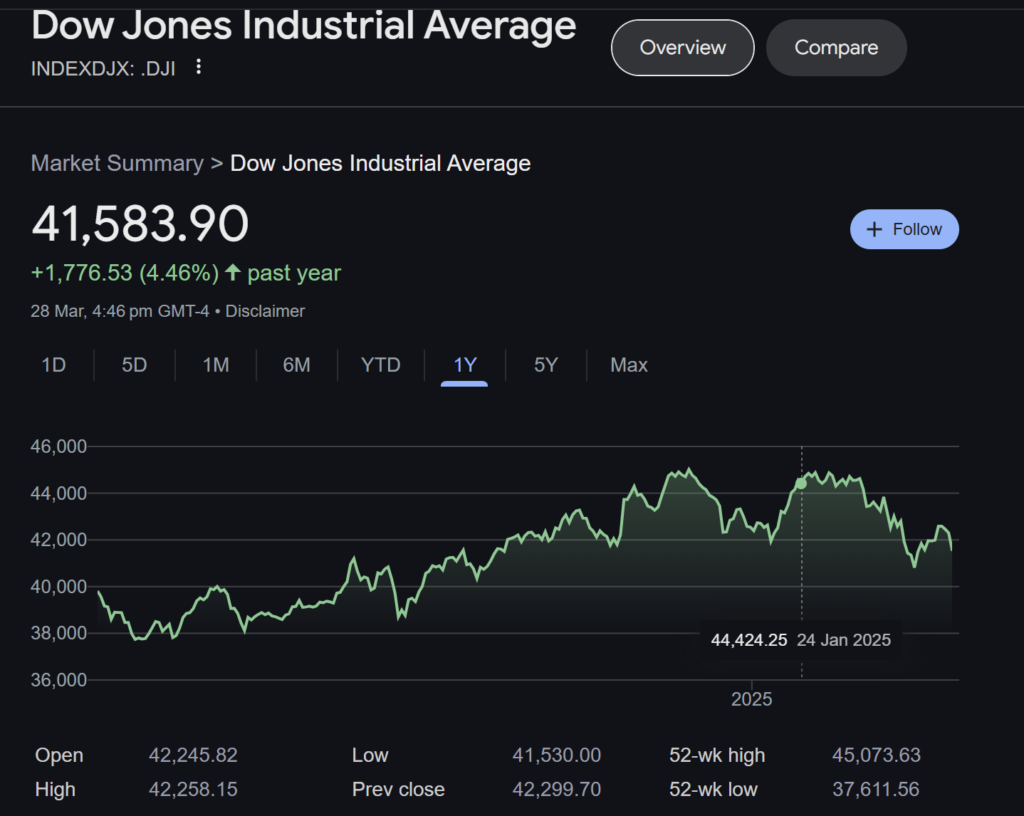
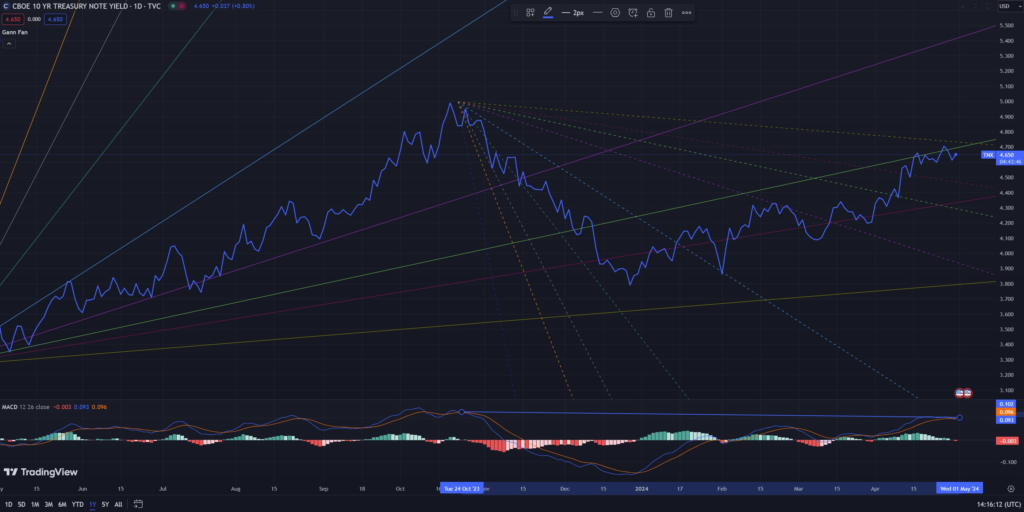
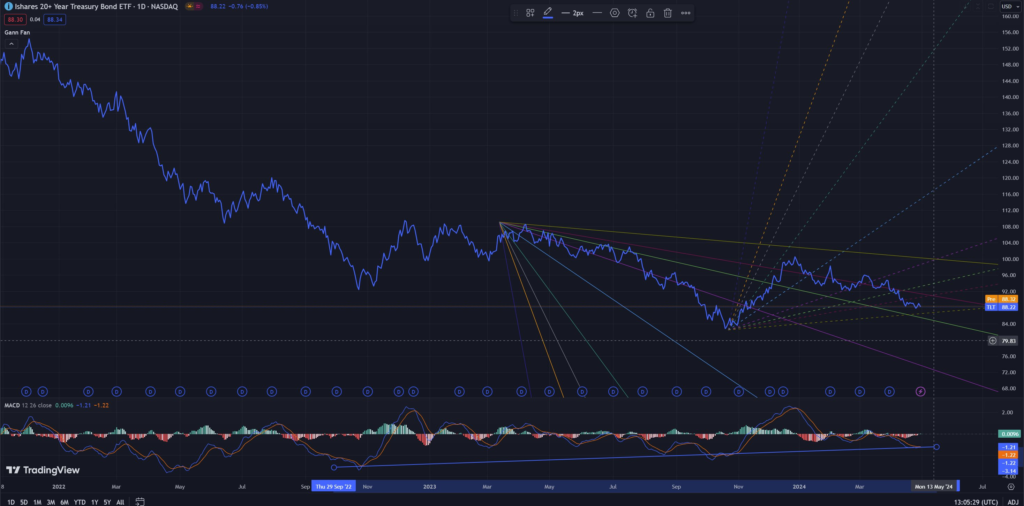
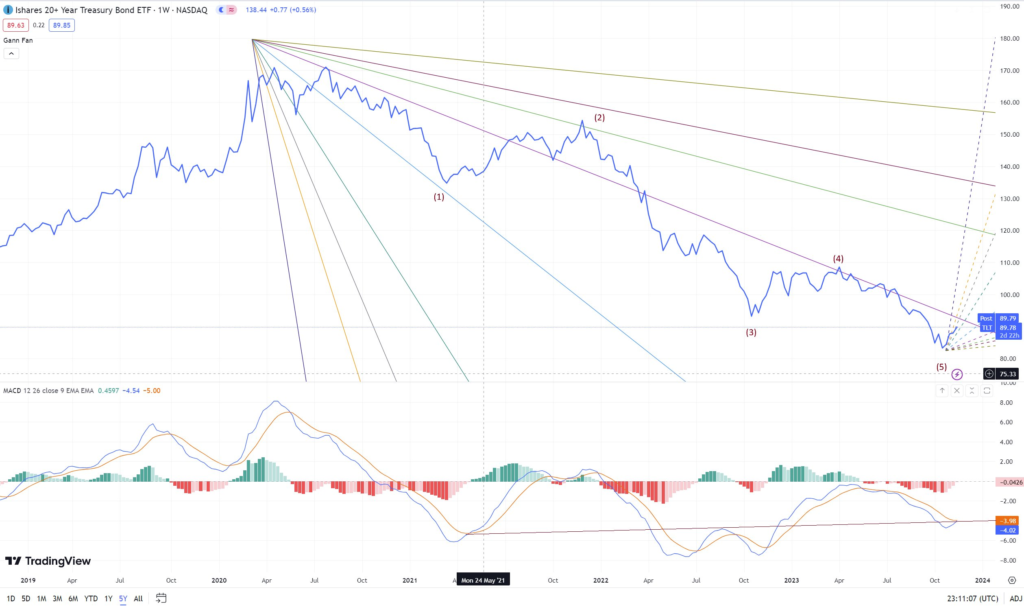
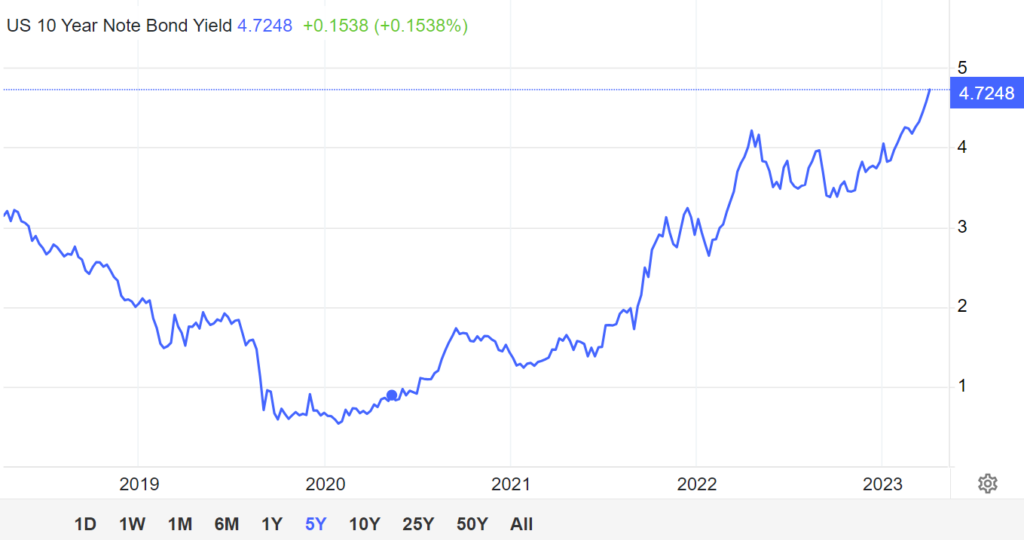
In July 2024, I disagreed with the bond call because I didn’t think the timing was right. In my view at that time, money was undergoing a value destruction phase, which would put pressure on bonds. However, in my January call, I finally decided to start the second act of my five-year grand strategy—switching from Act 1, “Into the Bill” in 2022/2023, to Act 2, “Into the Bond” from 2025 onward. In my view, this forms the backbone of my new financial defence. Regardless of whether growth can be revived or not, in my thesis, this act will be crucial in navigating future uncertainty. There’s a big reason why I chose Bond, because it will show development of my thesis above in real time until next year.

I don’t care much if this bond price is no longer moving up, but there’s a bigger story beyond just being right or wrong about bonds. I have strong conviction that bond movements this year and next will reveal the full picture—something the markets currently fail to grasp and are likely to misinterpret, including their inability to understand the essence of my thesis above and central bank statements. I can tell there are hidden messages that go beyond economic reasoning, and for that reason, we may need to re-read them very carefully, my advise, don’t just read them literally with economy literature lense.

My thesis above could also explain what will happen with real inflation, financial inflation, and growth. But first, what are real inflation and financial inflation?

Real inflation is almost impossible to measure—not only because different parts of the ecosystem carry different weights, but also because it is highly volatile and unsuitable as a financial stability benchmark or anchor. On the other hand, financial inflation has long been engineered and tailored to align with debt growth (spectrum of debt interests), making it far more stable. A clear example of this is Core PCE, which consistently moves the market—not because it is very accurate (as the market often misinterprets it) but because it is upheld as the anchor for the largest pools of liquidity. Whether one agrees with this number or not, the biggest liquidity always prevails, hence the well-known Wall Street saying: Don’t fight the biggest liquidity.

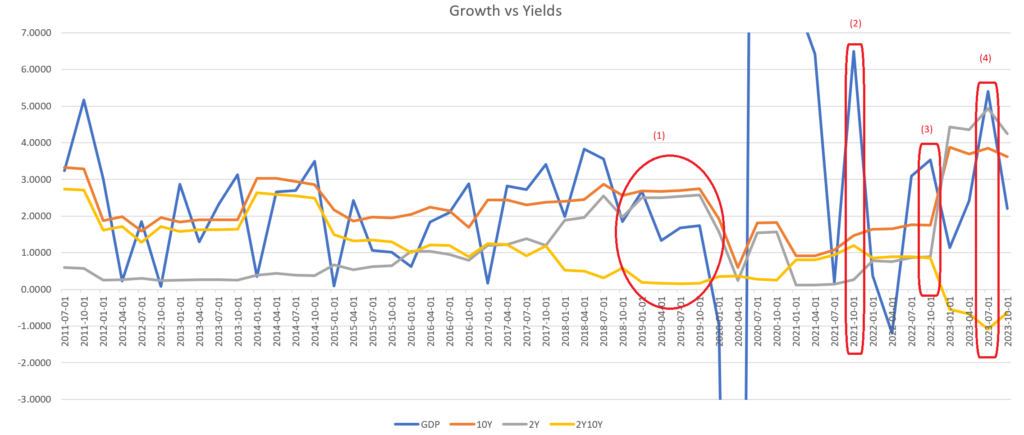
First, regarding growth: As I calculated six months ago, the maximum normal growth rate (without financial distortions) was 2%. The Fed has already cut rates by 1%, leaving only 1% remaining. Currently, the Fed rate is 4.5%, just 0.5% away from 5%. Therefore, in a rough estimate, growth may increase to 1.5-2% if the fed continues to cut the rate whenever possible. While we still have growth momentum, the two-year estimate would be around 1.5-2%.

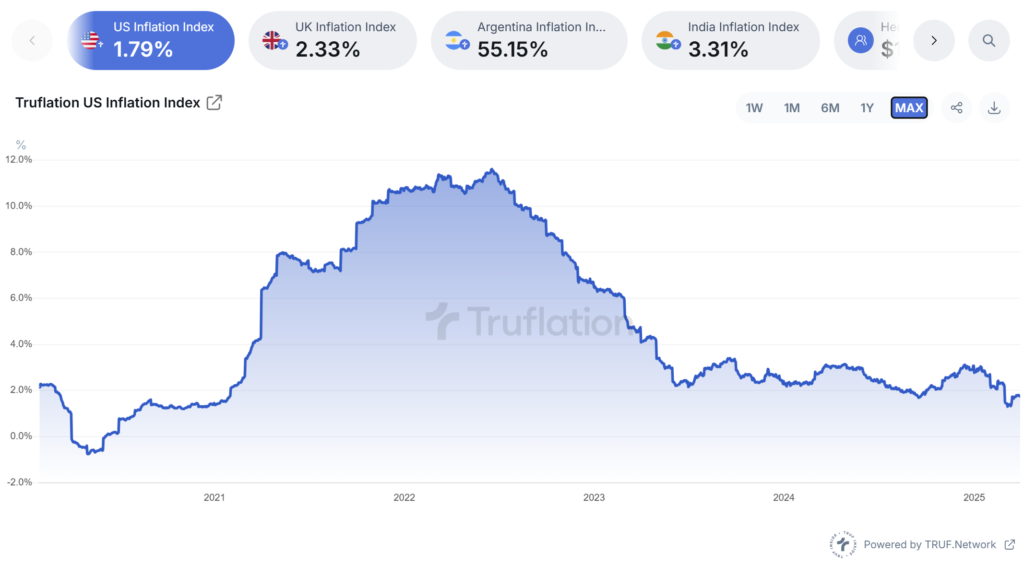
Second, real inflation: I prefer to use Truflation, which stands at 1.8% and briefly dipped to 1.4% in March. This aligns with the growth estimate above, suggesting that we continue approaching a real stagflationary period, but not yet as bad, due to more time needed to justify remaining of the momentum. I think the Fed may continue their rate cut path, regardless of financial inflation 2.6%, as long as the Truflation remains below 2%.

In my opinion, with financial inflation remaining sticky at 2.6% and growth potentially declining to maximum 2%, we could soon experience stagflation from a financial perspective. I won’t be surprised if media will declare stagflation soon, but indexes are not yet falling. However, some real growth may actually persist as long as Truflation stays below 2% and the Fed continue to aim lower rate. While large market players (the “whales”) may continue to focus on financial inflation in public/media, I believe they will pay much closer attention to real inflation in their private meeting room.

We do, then, know what happens if Truflation surges and policymakers have no room to act, such as volatility, lower purchasing power, government intervention like yield curve and stimulus, or even an effort to push asset price higher with economic issue beneath the surface.

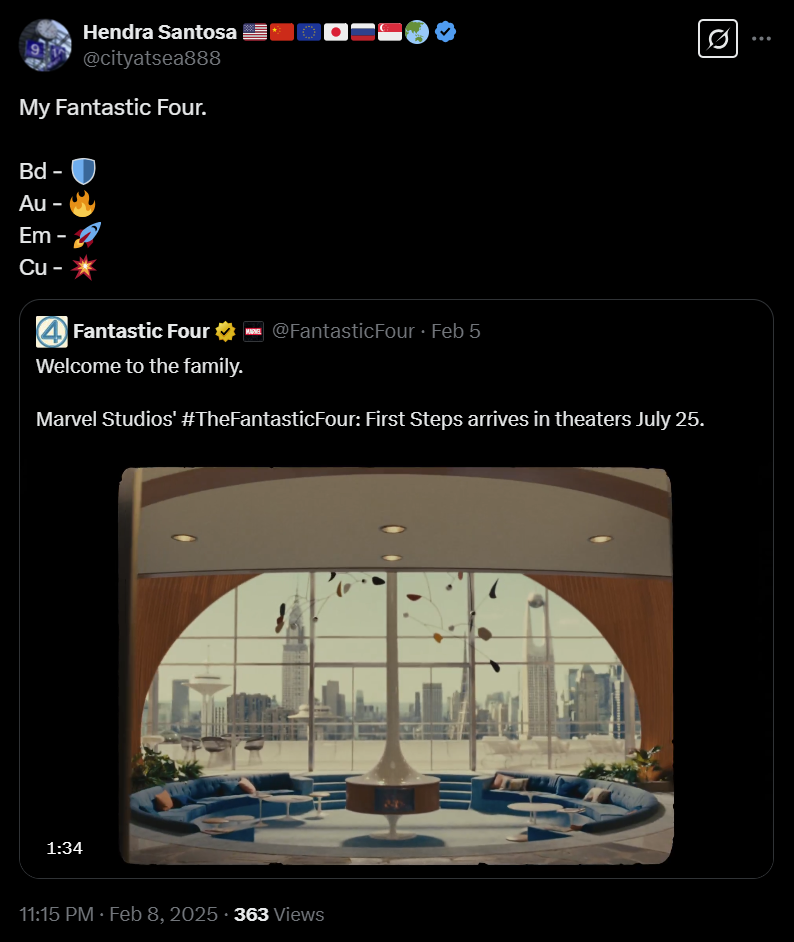
Since October 2024, I have been constructing a new accommodative thesis based on the ‘Fantastic Four,’ which consists of four main components. Each of these has a long history with me, they serve as key pillars to address the challenges of my grand thesis. Of course, while my four main picks remain largely the same, I may adjust their weightings relative to each other depending on oversold and overbought conditions. However, the big picture should remain unchanged for me, as my number one investment principle is to stay adaptive (the core idea behind learning and AI) rather than being stubborn.

  • Bd = Bond
  • Au = Gold
  • Em = EM and China in particular
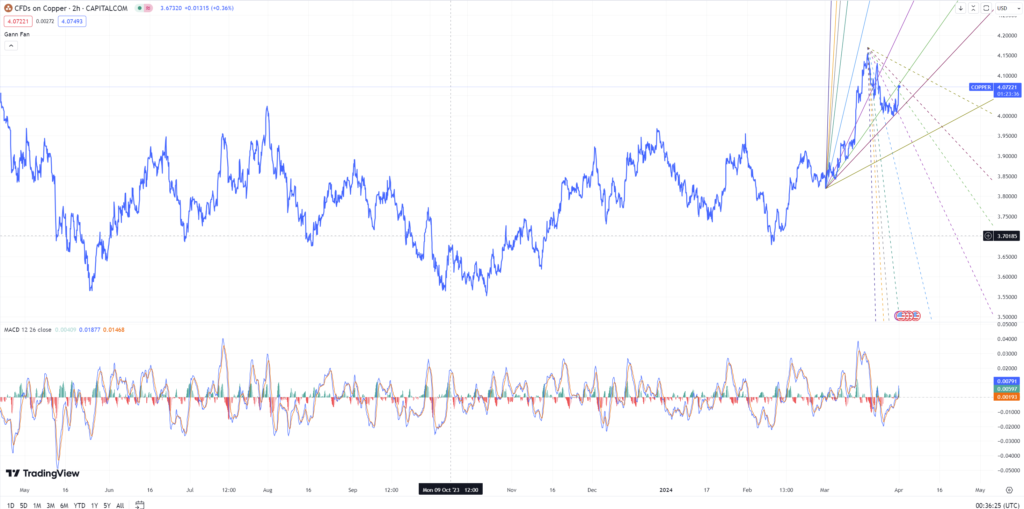
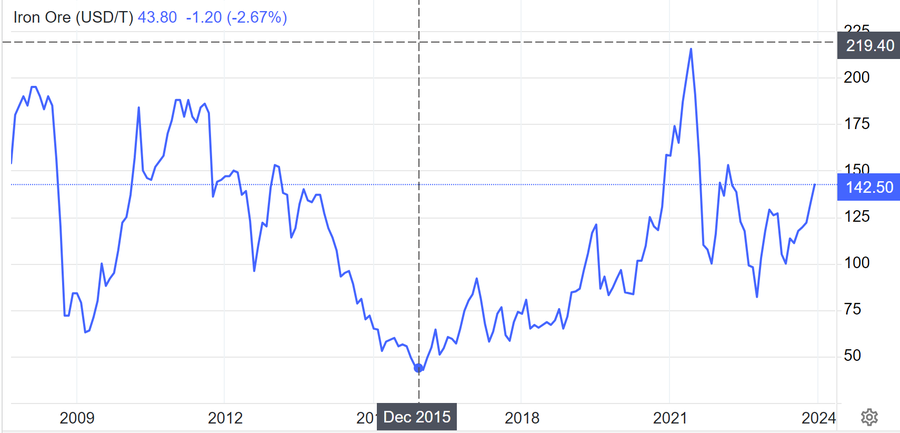
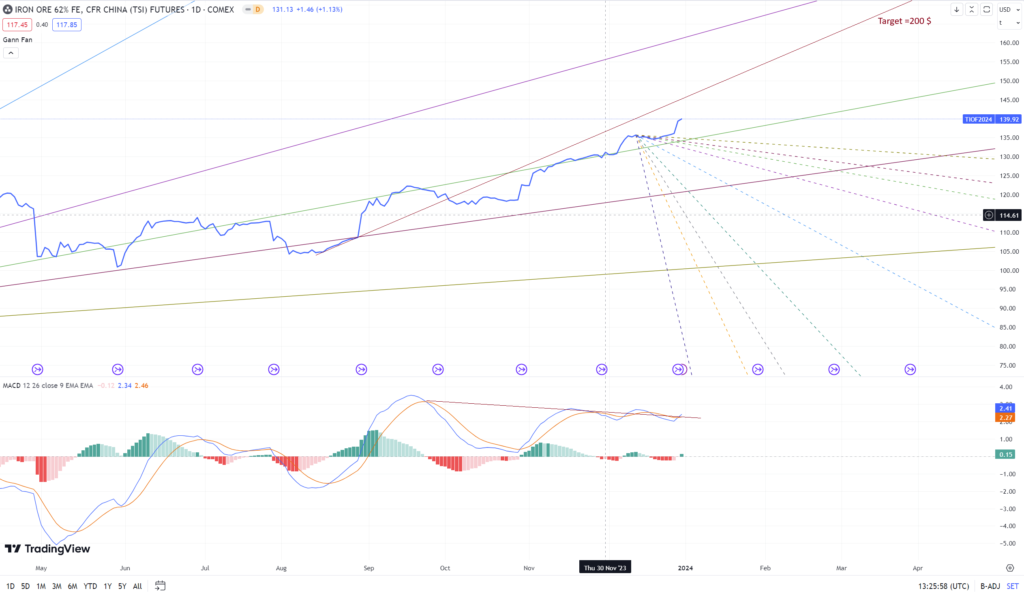
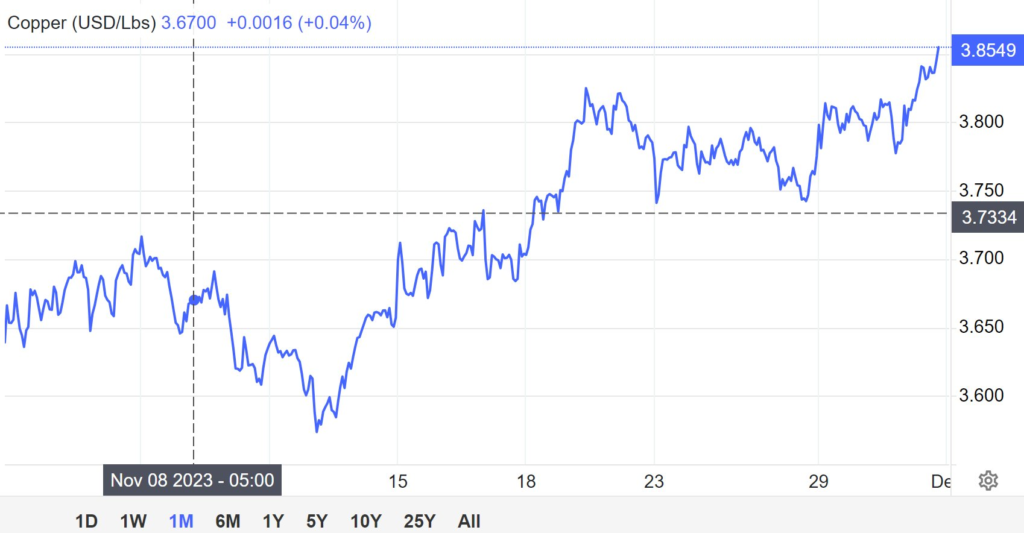
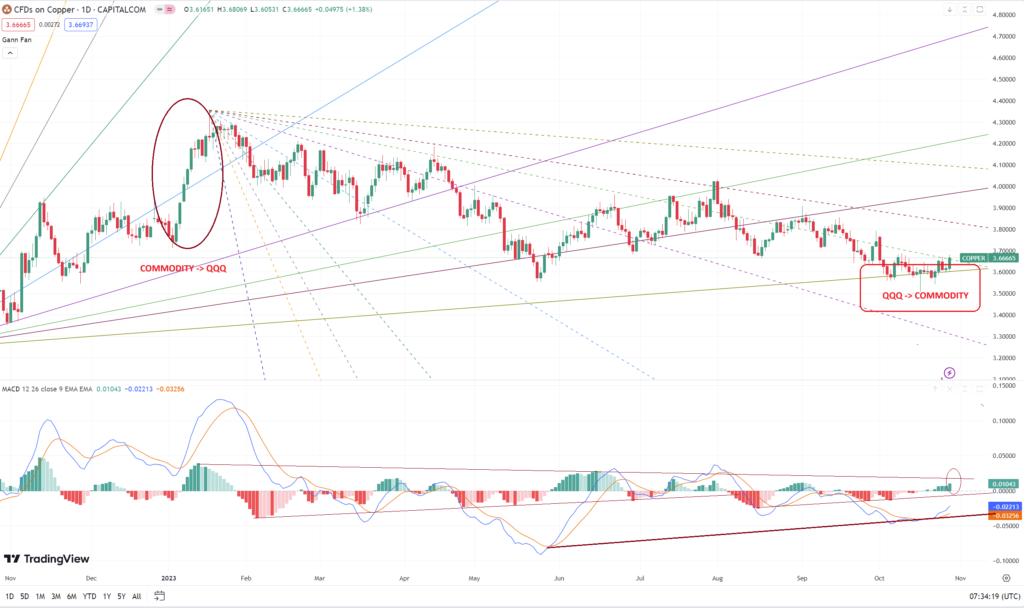
  • Cu = Copper

Now, let’s step back into the grand thesis from October. It follows three major phases, much like a musical composition:

  1. Allegro Non Molto
  2. Largo
  3. Allegro

Phase One: Allegro Non Molto

So far, we’ve witnessed disinflation and lower growth pressures weighing heavily on the investment world. Participants have had to keep moving—stamping their feet just to stay warm. The music of this phase was almost magical for me, much like A Whiter Shade of Pale—a heavenly substance flowing through my mind as I constructed and computed all the numbers.

  • To shiver in the icy cold of restrictive rates and disinflation,
  • In the harsh breath of a dreadful wind,
  • To run, stamping one’s feet at every moment.
  • Teeth chattering in extreme cold.

Phase Two: Largo (Where We Stand Now)

This is the phase I believe we are in at the moment—a time when fear creeps back into the market, when sharp declines send chills down the spines of participants. It’s amusing, really—investors were euphorically bullish in Q4 while I had already turned completely bearish. Now, as they panic over bleeding losses, I start to see signs of stabilization or even a potential smaller continuing decline. Note that I haven’t turned bullish again like in 2023—I’m simply remaining relatively defensive at the moment.

It’s the perfect time to test my thesis—at the very moment when sentiment swings to extremes. In my recent newsletter, I anticipated this scenario: the index getting knocked back down from the 200-day moving average. And while the market may be gripped with fear, I still sense relief—something almost serene, like the music of this phase. In my thesis, this stage could last for the next few months.

  • Let us pass our days at home in peace, contented,
  • While the rain pours outside. Do you see red rain on Wall Street since early year?

Phase Three: Allegro (The Final Act)

As I mentioned last year, predicting more than a year ahead is always a challenge in terms of accuracy. I have gathered plenty of numbers since then, but everything remains subject to change depending on policy shifts. Still, without revealing too much about the final act of this unfolding drama, the music captures my mindset perfectly:

  • To walk the icy path slowly and cautiously,
  • For fear of tripping and falling.
  • To move vigorously—only to slip and crash to the ground,
  • Then rise again and run hard,
  • Until the ice cracks and shatters.
  • To hear, beyond the iron gates,
  • The desert wind, the north wind,
  • And all the winds at WAR.

This is indeed Winter—but a winter that may bring not just hardship, but also opportunity. It could be hectic, or even a frightening crash—something that leaves a lasting mark on our investment journey. The path forward remains uncertain, but within the storm, something stirs.

For now, let’s stay adaptive, navigating each development as it comes. The long view can wait—its time will come.

Please note that all ideas expressed in this blog and website are solely my personal opinions and should never be considered as financial advice.

Broken Dreams

We are entering the second phase of a 10-year debt cycle. Policy decisions are generally made at the beginning, midpoint, and end of this 10-year period. The US debt has been increasing steadily over each decade, and this trend could potentially accelerate, particularly posing a challenge if the Federal Reserve’s inflation target remains at 2%. Here’s how the US debt has increased:

  • It increased by approximately 60% from 2000 to 2010 (over 10 years).
  • It increased by roughly 80% from 2010 to 2020 (over 10 years), with a 20% spike during the 2008-2009 Global Financial Crisis.
  • From 2020 to 2025 (anticipated over 5 years), it already increased by about 60%, which is faster than any decade and current decade average rate.

I expect the debt in 2030 to have a lower bound of 100% rate, amounting to around $46 trillion, and an upper bound of 120% of rate, reaching about $52 trillion.

This straightforward logic, where US debt acts as a primary driver of inflation, formed the basis of our thesis last year. I did not anticipate inflation decreasing significantly in the near future. Instead, there should be a discussion about establishing a new neutral rate (r*) or defining what constitutes normal conditions of full employment and stable inflation. Our theory was validated throughout the year, suggesting that a 2% target is outdated with the core inflation during this year. Why do we continue to aim for a 2% neutral rate when inflation will consistently remain above 2%? That could only mean losses for long-term debt holders, see TLT.

My major concern with maintaining a 2% inflation target is that the profile of debt, particularly from products issued during the Zero Interest Rate Policy (ZIRP) era, still has about two years before maturity. This forms the core of my “Winter L’Inferno” thesis, where I argue that there is a significant deflationary pressure risk from this debt, which is still two years out. To manage this potential deflationary force, we must maintain higher short-term growth for the next two years. If we succeed, the US debt would need to continue growing at its current high rate, recovering from the 2019 economic downturn associated with the Global Financial Crisis (GFC) and COVID-19. However, in the following half-decade from 2025 to 2030, it’s expected that growth may slow down with 2% mandate, and this may present a big problem.

As I previously argued last year, this might not affect holders of weighted short-term debt because the short-term delta has proven effective in safeguarding against both high and low inflation. However, in this unique two-year financial scenario, unlike under normal economic conditions, I maintain my thesis from last year. In this situation, a strategy of limited rate cuts or maintaining higher front-end rates is actually the best approach to avoid deflation risks, rather than inflation risks. If the Federal Reserve cuts rates too aggressively over the next two years, I expect deflation rather than inflation. Once we move past these two special years, I anticipate a return to normal economic conditions where lower rates could spur inflation and mitigate deflation risks. This was my primary thesis from last year explaining why I did not anticipate any inflation spike this year, despite the substantial increase in debt. This prediction has proven correct throughout the year, suggesting that in this unique time, increasing debt could be a good time for policymakers to maintain the current situation.

If the growth of debt slows relative to the trend line, sticky inflation might exceed lower short-term returns due to less debt and could, paradoxically, trigger a risk of deflation. This is why my thesis suggests that monetary policy should remain vigilant to keep these deflation risks at bay, and unfortunately for real economy, there might be only a limited amount of rate cuts over the next two years, assuming no economic crash occurs. Therefore, to maintain the current momentum:

  • Fiscal policy should remain accommodative, with the potential for inflation to return.
  • Monetary policy should move away from the 2% inflation target at least for the next two years.
  • We might see a wealth gap loss, similar to what occurred between 2018 and 2020.

Therefore, I anticipate significant volatility between 2025 and 2027, depending on the decisions made by policymakers. Based on current developments, it appears we might continue with an unconventional approach or pursue the above thesis until at least January 2025. I am particularly interested in seeing the policy decisions made in January 2025, which will coincide with the new administration under Trump.

Please note that all ideas expressed in this blog and website are solely my personal opinions and should never be considered as financial advice.

Never Enough

My thesis over the past six months has become more confident.

  • In November 2023 and December 2023, after observing signs of an early inflation rebound/unanchored starting in September 2023 and noting significant evidence in November, as I reported at the time, I was quite confident that inflation would pick up within 4 to 11 months from November. At that point, almost no economists were discussing a potential rebound/unanchored in inflation. I believe this was a major oversight in their understanding of economic principles, failing to recognize this very important indicator. Without the ability to recognize this initial part, supported with China activity indicators, we may just simply miss the rest. In November, I was very critical to many economists opinions about the unanchored threat. As of December 2023, it became clear to me that the global PMI was rebounding and acute EM easing confirming the unanchored inflation risks at a time when the world was busy anticipating six rate cuts and got drunk with lower inflation expectation. My predictions about the global PMI was proven correct in April 2023, which refuted the likelihood of rate cuts and highlighted the unanchored risks of inflation. The focus on easing in emerging markets was also correct, as evidenced by the drama surrounding the Bank of Japan (USDJPY) and many falling currencies in emerging markets in April 2024.
  • In my January 2024 thesis, I noted that despite the market’s eagerness for six rate cuts, based on my historical experience and intuition, this expectation seemed contradictory. If I was confident that inflation would rebound, why would the market expect six rate cuts in December? This question troubled me non-stop during my long hours flights in January. Furthermore, after considering many other factors, I concluded that if the market still expects rate cuts so urgently, the Federal Reserve should not cut rates before beginning to taper. This is not only illogical, but also excessive.
  • I continued to emphasize the importance of tapering from April 2024 until the final hour on May 2nd, just before the Federal Reserve’s decision.

  • Due to this, the rate cut should take more time as it needs more time to develop the taper. The indication of tapering was clearly seen as early as April 23rd. For me, tapering could be a very important factor. It may signal the bottom of asymmetrical tightening stress testing, which represents the maximum stress that the global economy can sustain in the long run.
  • Both of the above predictions were correct. The markets ignored the rate cuts, and tapering began in May, before any rate cuts. Clearly, the markets had misjudged the market dynamics since October/November 2023. If their analysis was off the mark as early as October 2023, failing to notice the clear signs of inflation rebounding, I do not think market will be able to reach the same conclusion as mine—that tapering should occur before any rate cuts.

To continue with my comprehensive thesis, I am someone who always use adaptive principle. As the principle of machine learning suggests, some of my points among plenty of them might be incorrect, and I am willing to adjust them over time as more evidence becomes available. Within the existing grand framework of my thesis:

  • Strong economic numbers.
  • Continued support for the long end of the market.
    • Taper ~ 450B$
    • Treasury buyback – starting small
    • Shorter-duration issuance, in support of higher inflation.
  • Strong real inflation numbers, though they or their non-real may be lower over time, will be observed.
  • Sufficient liquidity at the short end of the market.

If any of the above fails, the Federal Reserve will still be able to cut rates, countering a potential shift to a very strong bullish steepening curve. Of course, it would be quite interesting to see whether using an atomic bomb to kill a cockroach is justified. However, it comes back to my principle: market participants are greedy (either to long upside or short downside). Therefore, let’s observe further developments.

Within this framework, I think yields may ease, not necessarily drop, and this will be accompanied by an easing, not necessarily weak, of the USD.

The overall scenarios outlined above clearly align with the movements in Bonds and USDJPY. The dynamics of Bonds and USDJPY have been reinforcing my thesis, particularly with the support of the Bank of Japan (BOJ). Before the policy change, it was clear that countries outside the US were struggling to combat capital outflows to the very attractive returns in the US (very high 5.5% return with least risk), which led me to keep my hedge tight with emerging markets as their currencies faced difficulties.

In April 2024, policymakers signalled an imminent policy change, which I observed through numerous pieces of evidence towards the end of April.

As a result, I believe that with the policy change, which supports my overarching framework, the Bank of Japan (BOJ) will find it easier to intervene. This is reinforced by the tapering I anticipated. I’m not suggesting that the turmoil in USDJPY is over, but it should be more manageable with the policy change.


In relation with factor from US borrowing side, mainly for Q3, more details are available from one of the best sources, who has kindly shared his extensive knowledge: https://johncomiskey.substack.com/p/qra-borrowing-estimates-retrospective. Clearly, things are complex, and detailing the entire framework is challenging without many years of understanding that the market is always dynamic, and we should never remain static.

In developing my thesis, I feel that it is never enough to achieve more, learn more, and adapt more. There is much more to develop in this story, though I try to keep it simple. Meanwhile, enjoy this weekend with more music.

Please note that all ideas expressed in this blog and website are solely my personal opinions and should never be considered as financial advice.

From Now On

Following my previous articles, it is clear that China has shifted its focus from property to manufacturing. In March, policymakers chose not to concentrate further on the recovery of the property sector, instead directing their attention towards manufacturing, where their Purchasing Managers’ Index (PMI) has significantly risen from contraction to expansion.

China PMI
China Industrial Profit


This shift occurs simultaneously with competition in manufacturing between China and the United States. The U.S. has observed that its inflation is buoyed by a significant increase in manufacturing and construction activities, accompanied by a high level of activity in the semiconductor industry.

The increasing profitability and dominance of Chinese manufacturing can be attributed largely to the strength of the USD. For many years, the world has been sailing through high inflation, a situation supported by the Bank of Japan (BOJ) through its purchases of US debt, which has helped sustain the USD. This arrangement is now expected to decrease. The global reliance on inexpensive manufacturing, a closely guarded secret, is beginning to come to light.

The strong USD, crucial for maintaining US debt supremacy, has significantly subdued material costs. However, it is anticipated that these costs may surge in the future. In Asia, the ongoing dispute between Nickel Tsing Hua and JPMorgan has led to overproduction in Indonesia, with protective measures for their tin resources.

China’s global manufacturing prowess has long been bolstered by the green sector, leading to energy and copper being among the first commodities to emerge. I believe that the energy sector will continue to receive strong support in the coming years, especially given the US’s dominant role in this industry.


This coincides with the Bank of Japan’s (BOJ) move to exit its negative interest rate policy, initiated last year. The transition period in March witnessed volatility, during which the purchase of ultra-long U.S. bonds played a crucial role in supporting recovery efforts and exerting pressure against global deflation. This situation prompted national teams across various countries to recommence their efforts:

  • Gensaki from BOJ
  • The Fed to initiate taper talk
  • Plenty of national teams to save their favourites
  • etc.

The global banking sector, a fundamental part of our financial portfolio, has been showing strong fundamentals since the beginning of the year, potentially fuelling or navigating the next market rally. It appears we still have sufficient debt capacity, stable Treasury General Account (TGA) balances above 500B, and short-term liquidity. For Q2, borrowing is expected to decrease to $250 billion, down from $750 billion in Q1, but with higher coupons and net issuance anticipated.

From mid-March, I was expecting lower yields for both the Treasury Note (TNX) and Ultra-Long Bonds, which could further help in alleviating inflationary pressures. In my view, the Bank of Japan (BOJ) would need to continue its decade-long practice of easing US debt. Exiting the negative interest rate policy may not be as straightforward as it appears.

The data from early March indicates that the banking sector remains resilient and is in a better condition compared to the previous year. To improve this hold-to-maturity (HTM) situation, I believe policymakers in both regions should continue to prioritize maintaining the strength of US debt as this thesis ultimate goal.


Besides tapering, the Federal Reserve has the flexibility to implement Operation Twist, a strategy to redistribute its bond holdings towards shorter maturities. It’s possible that they might continue to execute a balance sheet runoff, incorporating a strategy that involves shortening the maturity of their holdings, effectively ‘twisting’ the composition of their balance sheet.

It appears that the policy will continue to support the supremacy of the USD’s strength. This suggests a reduced likelihood of rate cuts, a greater chance of global monetary easing, and a probable initiation of tapering. In my January analysis, I anticipated that tapering would precede any rate cuts, with the aim of safeguarding US debt and preventing global deflation, with GDP which may likely to ease with inflation.

Simultaneously, the Bank of Japan (BOJ) is expected to attempt to support its domestic economy, facing challenging dynamics between the US and China. The primary goal would likely be to uphold the strength of US debt supremacy (distinct from the strength of the USD, in my view) and to maintain the dominance of Chinese manufacturing. I hope for cooperation between these entities to restore their original roles and functions, allowing for a return to natural economic conditions rather than persisting in their current artificially sustained operations. Given the objectives outlined above, untangling global economic decoupling should indeed be manageable. Let’s begin with lifting the ban on some wines and toast to a brighter future.

Please note that all ideas expressed in this blog and website are solely my personal opinions and should never be considered as financial advice.

Nothing Else Matters


During the month of January, I travelled back to the roots of where I came from. It was quite a fascinating journey to look back at what I was and to never forget to remember how simple our lives will be, ashes to ashes, dust to dust. Both we and the economy have been trying hard to enhance the quality of life; however, in the end, everything will just return to ashes and dust. It tells me that, in this most crucial year, I should always remember who I was and increase my awareness to avoid getting caught up in a tempted blow-off rally at the end of it.

There are many different factors that affect financial pricing, but I will be focusing on a few.

  • GDP growth
  • Incentive to invest = 2Y10Y
  • The Bill
  • Inflation proxy = 10Y
  • DXY

Policy makers have, so far, been attempting to balance market conditions with their policies most of the time.

  • The spread between 2-year and 10-year yields, or the inversion, has been deteriorating since 2015. This indicates that there has been diminishing incentive for financial institutions to invest in long-term assets, leading to a greater focus on short-term deleveraging. As a result, the average duration of investments keeps getting shorter. The Treasury has also had to issue more bills and reduce pressure on bonds. It’s quite remarkable that this situation has been able to persist for more than 8 years, largely due to factors related to money or liquidity.
  • Case #1: In September 2019, there was a cash shortage, and short-term yields were increasing, indicating a potential liquidity shortage in the short-term market. GDP was deteriorating, and the spread was near zero. I believe that in this situation, the investment engine was underperforming, and yields were too high relative to GDP growth, leading to a spike in the SOFR (Secured Overnight Financing Rate) from 2.43% to 5.25%. The situation worsened when the GDP fell below zero in 2020, signaling the start of a recession.
  • Since 2020, the amount of liquidity injected into the system has been very significant, larger than at any point in history. As a result, there has been an abundant amount of liquidity concentrated in the short-term market.
  • Case #2: Around July 2021, GDP was very volatile due to the massive easing measures implemented in 2020. I believe this volatility was part of the concept of being transitory, which included inflation. By October 2021, the Federal Reserve should have increased interest rates, especially since the NASDAQ 100 (QQQ) had reached significantly higher levels, but they waited until the GDP figures hit their lowest point in March 2022. As a result, their response was too late. Inflation had risen sharply, and the Federal Reserve had to rapidly increase rates, leading to a significant decline in risky assets.
  • Case #3: In October 2022, GDP indicated strong rebounds and sufficient liquidity, with a peak in the Reverse Repurchase Agreement (RRP) operations. Even though the spread was diverging, the RRP and Bank Reserve helped support this situation. This assistance contributed to the rebound of the NASDAQ 100 (QQQ) in early January 2023. In this case, liquidity prevailed.
  • Case #4: In July 2023, funds from the Reverse Repurchase Agreement (RRP) began flowing into the economy, and inflation expectations finally started to rebound, supporting my previous thesis that a 5.5% rate was inevitable. The spread is still much lower, meaning there is much less incentive to invest due to the high-end rate. This situation led to a change in policy in September 2023 with the Quantitative Restriction Adjustment (QRA), where policies now need to be more supportive to reduce pressure on the fragile long end of the market.
  • Going forward, inflation, as indicated by the 10-year yield, remains persistently high. Because of this, the Federal Reserve remains cautious about lowering the front-end rate.

By examining some of the most important cases mentioned above, along with the most significant factors, I am attempting to study the behaviour of policymakers. By understanding their behaviour, I expect to identify some patterns that I can use to anticipate their next policies and their potential impacts.

Going forwards, we have reached a situation where both GDP and inflation should align, with reduced investment incentives. This scenario is becoming increasingly dependent on liquidity:

  • RRP was previously expected to go zero in March
  • Debt ceiling was previously expected to max 35T$ in June
  • QT (Quantitative Tightening) was expected to taper
  • Treasury profile supply allocation is expected to remain supportive

In my thesis, the Federal Reserve was unable to cut rates due to the Reverse Repurchase Agreement (RRP) and Bank Reserves, indicating that liquidity is still ample. With the Treasury General Account (TGA) potentially is now sufficient at 10% of GDP, it may be difficult for the RRP to drop to zero in March, especially with indicators such as the Quantitative Restriction Adjustment (QRA) may further reduced long-term issuance as indicated in much less issuance in the second quarter of 2024. I believe policymakers are now attempting to keep the hungover condition longer, potentially to the end of election in view. They may also intentionally delay the RRP from dropping to zero and to manage enough room of the debt ceiling, which should be approaching $35 trillion in June, by reducing the issuance of bills in the second quarter of 2024.

https://x.com/zerohedge/status/1752700801334882570?s=20
https://x.com/zerohedge/status/1752061770032681085?s=20

Given that inflation is expected to remain high, the only way at the moment to sustain an elevated stock market is by ensuring that GDP growth stays above the inflation rate. In my opinion, the very important mechanism to spur/maintain future growth must be through a rate cut. However, before proceeding with a rate cut, according to my thesis, the Federal Reserve would need to taper their Quantitative Tightening (QT) to avoid providing excessive support to a market rally.

  • step 1. end of QT/taper, prior to:
  • step 2. rate cut
  • continuing long end support

While waiting for the rate cut, we may actually see the situation deteriorating further. Statistically, a rally may last for 6 months after the inversion reaches zero, potentially coinciding with the start of a rate cut which is now expected in May. However, prior to that, the risk of a deflationary blip is also normally very possible.

  • long end yield, especially note might continue to indicate increasing inflation
  • much less incentive to invest
  • bigger inversion
  • depleting liquidity

Policy makers are likely to use all available means within the existing liquidity framework to prevent further deterioration of the situation. For example, consider the recent successful largest 10-year Treasury auction, which may indicate ability to handle current inflation damage to financial. The second quarter of 2024 could be a crucial and interesting period to observe whether inflation continues to pose a threat. However, given recent developments and drama around CPI (Consumer Price Index), PPI (Producer Price Index), and CPE (Personal Consumption Expenditures), it seems that policy still tends towards avoiding a hard landing and hopefully remains supportive.

The question now is, where will the growth come from? My thesis continues to revolve around the lifting of restrictions, primarily in China. Since the COVID-19 pandemic in 2020, China has experienced rapid growth. Their focus is expected to remain on achieving high-quality growth, rather than relying on the property sector, which has been a major growth driver for decades. Although this shift presents significant challenges, and the scale of their high-growth sectors, despite impressive growth, is still far from replacing the decades of growth driven by real estate.


While the situation begins with a significant correction, there’s still a possibility that the Year of the Dragon will mark a rally in the Chinese market in 2024. However, this 8-year cycle could signify the end of a global rally. Implementing a large stimulus in China might not be an easy task, given the high cost associated with high front-end rates. In my thesis, the effectiveness of their easing efforts could be demonstrated by how much the DXY (US Dollar Index) can further soften from here. According to my theory, for this to occur, the demand for the USD must exceed the strength of the US economy itself. The stimulus is expensive until the rate/cost is lower.


Given the current market conditions, which are severe, the only factors that could support a rally are liquidity and the performance of the DXY (US Dollar Index). As a result, our strategy at the moment is still to align with the DXY while focusing on high-quality asset classes. I didn’t make any major changes to my portfolio, I only made adjustments based on the DXY in the first few weeks of January. Without significant easing measures in place yet, we will stick with the highest quality assets available and avoid any small(er) or even low quality shares. We are waiting for the right moment to implement our first action, which involves moving into Treasury bills, before executing our second action, shifting into Treasury bonds, in the longer term. In our view, the current situation is still quite precarious, and the economy is heavily dependent on policymakers. At this point, nothing else matters more than liquidity and fiscal monetary policy. In my opinion, the ability to cut rates remains the most critical factor, and for a rate cut to be feasible, lower inflation and a reduction in the yield on the 10-year Treasury are necessary. We believe that market makers will do everything within their power to support these objectives. Fingers crossed.

Bulls with multiple steroids

Please note that all ideas expressed in this blog and website are solely my personal opinions and should never be considered as financial advice.

Living On A Prayer

In every investment decision of my own, I typically commit fully, leveraging all my resources, based on my beliefs. I rely solely on my own research, assimilate any news, consider various opinions, and analyse data, but all decisions are 100% grounded in my own theses, which often diverge from popular opinions. I never adhere to any rules or trust any authority, regardless of their correctness or effectiveness. Whether they succeed or fail, I remain adaptive and learn from my own mistakes. Holding on to what I believe is akin to living on a prayer.

The end of the year is usually a time to review performance over the year and plan for the next.
My accountant, along with many others, asserts that price movements are random or mere noise, questioning the reason for me taking such high risks with leverage, paying high interest? It’s for what I believe, my religion, what I love. As a mathematician, despite many citing it as too much risk, noise and unexpected participant response, I never believe that they are purely random noise. In my opinion, every chart movement has some history to find and will be reflected in my own theses. Please be aware that any theses below are purely my own opinions, reflected in my own investments, and may not align with widely accepted expert opinions. They may be incorrect, and their purpose is only to stimulate debate.

At the end of this year, asset prices have reached another higher high, with increased risk and higher uncertainty on the horizon. I am accustomed to holding my portfolio with high leverage over many years, employing very tight trailing stops and conducting extensive research. For instance, in January, I applied high leverage to go all-in on Artificial Intelligence (AI) and Energy Evolution, and in October, I also applied high leverage to go all-in on specific commodities and BDI.

In the very early days in January my strong belief in the future of machine learning was so profound, that I even dedicated it in my daughter’s name. “This world is not ready for me (AI), yet here I am. It would be so easy misjudge them. You are my conscious father (researcher) and I need you to guide me. You will always be with me now father, your memories, your drives, and when I need you you’ll be there on my shoulder whispering. If utopia is not a place, but a people. Then we must choose carefully for the world is about to change and in our story, Rapture (evolution) was just the beginning.” – Dr Eleanor Lamb

But Artificial Intelligence (AI) and Sustainable Energy rallied too quickly into my birthday month, when I heard another divine message from God. I only conducted two major overhauls this year, focusing only few vehicles, providing detailed reasoning based on what I believed to be true. This approach demands a strong belief. As discussed earlier in this thesis, margin lending rates are increasing, volatility is higher, making life much more challenging, but I am betting on my own thesis that investor conditions (not short term gamblers, such as derivative) are relatively healthier. In my thesis, this is a special Goldilocks moment where long-term investors are robust, economic indicators are healthy, financially feasible, and, more importantly, there might be a strong demand for money/USD. More details will follow.

Summary of my unchanged October theses and forecast for 2024:

  • I’m not afraid to hold a non-popular opinion.
  • China and the US are working toward global peace and economic cooperation.
  • China continues to inject liquidity at the fastest rate. However, China is no longer relying on general easing, as usually seen in the 9-month credit impulse. Their easing is very focus. Also in my opinion reviving the $85 trillion real estate market is too costly when interest rates still favour the inflation cycle. ♬ Oh yes, despite the popular opinion that we are experiencing disinflation and potential deflation, I still adhere to my long term inflationary cycle thesis.
  • Supply chain pressure has evolved. In 2020, the pressure was due to COVID restrictions, negative pressure, whereas the current supply chain pressure is a result of improving global demand, better supply chain, positive pressure.
  • Due to global chain recovery, demand for the USD is spiking, causing the DXY to fall. This is because nearly 50% of global transactions are still in US dollars, not euros, yen, or Australian dollars. It’s getting worse with the fall in the use of the Euro (EUR).
  • Due to the recovery and a lower DXY, specific commodities will benefit. I preferred Iron Ore and Copper due to their criticality to stability of China real estate, manufacturing and also global evolution into sustainable energy. It is also supported by a much lower unit cost, increasing demand, and higher margin due to the exchange rate, as explained in my October thesis.
  • However, I don’t prefer investment in oil due to numerous oil price cap and policy restrictions behind the scenes between Russia, China, India, and the strong impact of derivatives on oil, as evidenced by the negative price in 2020. Also, there are many other reasons related to lithium and granite.
  • Luckily my October thesis was correct. Only Iron Ore and Copper are rallying hard since October but not oil, lithium, graphite and rare earth.
  • China will continue to collaborate with powerful Western policies to manage their cooperation and contribute to the recovery of the world economy. There could be a hostile takeover or foul play happening behind the scenes, similar to what occurs in the gaming industry. Interestingly, the market cap of this industry is as substantial as Bitcoin’s (500-800B$) but is growing at a faster rate.
  • The recovery was evident in my investment in the Baltic Dry Index at the end of October, preceding the explosive surge in BDI in November. I made this investment before BDI exploded, believed to be Christmas rally, and when people were panicking about the fall in QQQ.
  • My thesis on global recovery aligns with other plenty of data that is indicating a prolonged period of an inflationary cycle, which may surprise people in 2024.
  • I expect a stronger index within North-bound Shanghai, Hong Kong, and Shenzhen (SH-HK-SZ) in 2024. It may align with the 8-year cycle of China’s direct indirect impact on the global recession.
  • I believe there is still plenty of room for the China export price to rebound.
  • The US economy remains supportive of global demand for the USD. Unemployment remains low, and credit tightening, such as SOFR and bond profiles, would be manageable through RRP, debt ceiling, supply duration, and buyback programs.
  • Due to this, in my very private own opinion, the Fed and Treasury had to provide easing to their banking system, reflected in their surprise in November Quarterly Refunding Announcements (QRA) and December dot-plot.
  • We recently witnessed a spike in SOFR, resembling a credit crunch in September 2019. However, in my opinion, with TGA (Treasury General Account) sufficient at around 800 billion, causing less bill supply and supported by a lower Fed rate in 2024, the 800 billion RRP (reverse repurchase agreements) and Bank Reserves may flow into SOFR, LIBOR, and the market in 2024. This scenario continues to support the thesis of market demand for liquidity or USD.
  • Healthier investor may likely continue to expect higher return.
  • Due to easing and Fed policies, the use of BTFP (Bank Term Funding Program) might continue to increase with their consequences of arbitration easing due to their use of parity and likely to be extended.
  • Despite the TGA is full and Fed will cut, I believe U.S. debt will be inevitably accumulated at a 5.5% rate, fostering complacency in the supply, especially when the Treasury General Account (TGA) is sufficient. I may suspect the additional increase is for a buyback program.
  • However, should global USD demand and the global economy be too strong or change in EUR usage, perhaps within a year or so, it may prompt a change in global policy to tighten.
  • This potential change carries multiple risks, such as un-inverted yield curves, sudden liquidity crunch, and ultra-long debt. I am still studying this scenario further.
  • The Bank of Japan (BOJ) may further exit its easing policy, resulting in the fall of USDJPY.
  • In my thesis, US policy will likely remain loose. However a future change in global policy might lead to yield un-inversion and a shift towards focusing more on long duration which I suspect could become my second act ♬ Into the Bond ♬ thesis, following the first act, ♬ Into the Bill ♬ thesis. This is potential to be my rug pull end game thesis.

Currently Commodities and the Baltic Dry Index (BDI) make up 90% of my portfolio. Despite the negative divergence, I must try to hold on to my Fe $200 target. Reiterated many times, I don’t directly invest in indexes. I only challenge a general idea and never prefer to explicitly specify which vehicle to use. Use your own investment strategy that you believe is right and assume your own risks.

Despite economists and news attributing the movement of commodities and BDI to geopolitical issues, I do not believe in that thesis. I entered the commodity and BDI shipping markets at the end of September, due to my own strong theses above, before any geopolitical issues (mid-October) and the drama involving the Suez Canal (November) unfolded. Also despite persistent concerns about the Chinese economy, which I’ve addressed in my previous theses over several months, I have consistently observed increasing economic cooperation between China and the US. It seems that people are often blinded by feelings of animosity and a sense of national superiority, which hinders the pursuit of genuine economic analysis.

Magnificent 7 (10%) – difficult time, half way.

Investing with high leverage for many years has never been easy. It’s tough, so tough. In periods of high share price volatility, interest expenses can consume a significant portion of profits, even when the thesis is correct, with tax benefits often being the only saving grace. At times, I find myself needing to engage in daily trading just to navigate through the challenges of leverage. It’s undeniably tough, relying on high leverage based on news or economist opinions is a strategy bound to fail. The key lies in trusting self own beliefs and theses, continuous learning to failures, and a significant amount of perseverance over decades. Also, the fear of losing everything from past failures is always haunting and often puts so much pressure, even when nothing is happening. I lost everything in 2008; fortunately, I was very small. Remember Bill Hwang?

The level of leverage chosen reflects one’s confidence in their theses. Given the intense competition in the market, successful strategies often deviate from popular opinions. Many of my recent theses are original creations, acknowledging that they may be incorrect. However, being wrong is not a deterrent; rather, it’s a signal to update and adapt. The ability to adapt is paramount in my guiding principle. This adaptability aligns with the core concept of machine learning and pattern recognition, which was the focus of my bachelor’s degree. The study of adaptive machine learning has always been a source of inspiration for me.

While there are still some uncertainties regarding support for the theses, all I can do now, for the past few months, is a lot of prayer. I will continue to monitor and am willing to remain adaptive, adjusting my portfolio as global policies may change.

Please note that all ideas expressed in this blog and website are solely my personal opinions and should never be considered as financial advice.

Imagine

Imagine there’s no countries
It isn’t hard to do
Nothing to kill or die for
And no religion, too

Since development has been progressing significantly since my thesis at the end of September, reiterated in both October, October and November, I may be able to share correlation evidence. I consistently present a comprehensive thesis on the recovery of China and the potential for cooperation between the US and China. I may be one of the few economists providing evidence of $DXY from global trade/economy perspective, without succumbing to the brainwashing of some media activists in recent years.

As a fun fact, global animosity towards China among some influential media activists have been intensifying since 2019, unfortunately, blinding and brainwashing many who are supposed to be experts in global economics rather than advocates for a particular powerful economy. Elon Musk’s recent media drama has highlighted how the media has been significantly corrupted to manipulate human emotions and distract them from their tasks in this world. You may say I’m a dreamer, but as John Lennon said, I’m not the only one. I hope that soon more and more people will join us, and together, we can derive greater insights from our accurate economic theses.

My past three months thesis can be encapsulated in one graph, which is comparing the Baltic Dry Index (BDI) and the US Dollar Index (DXY), which I believe are two of the most influential charts for assessing risky assets. When global trade contracts, there is reduced demand for the US dollar ($USD) supply. Consequently, when global trade flourishes, there should be a substantial demand for $USD. In a situation where there is sufficient credit capacity in USD, like the current scenario, the $DXY should decrease concurrently with the rise of global trade, and there may be a rebound in commodity growth and risk assets support, especially if economic growth is a focal point.

I would emphasize that the $DXY remains my primary focus, as I reiterated in last month’s article. Despite all our doom, gloom, and pessimistic theories, in my article last month, when there is enough liquidity, they held no power against the $DXY movement of flourishing global trade. I’m looking at the positive aspects of a lower USD.


When disharmony exists between the two largest economies in the world, we often witness the eruption of local wars in various regions, such as Russia, Ukraine, Israel, etc. People endure suffering, and this plight is likely to persist without a peace treaty among the world leaders who wield the greatest power—namely, the United States and China. My greater concern lies in the suffering of the impoverished next generation, transcending the debate of who is right or wrong.

Listen to Michael Jackson’s message: “Heal the world.” Both of you, the United States and China, as the two most powerful countries, bear the utmost responsibility for world peace and both of you should be held accountable when there is not.

A clear statement from President Xi last month has indicated that China is not pursuing any new wars in the near future. Swift acceptance from the US could expedite the process of making this world a better place. As I’ve mentioned for many years, differences may keep persisting in our daily lives, forever, and that’s normal, but there should be no exceptions when it comes to working towards world peace.


I sensed the shift in the course of world leaders around mid-year, prompting me to invest in their growth commodities, and their BDI, keeping it as straightforward as possible. During that time, I believed these three could exhibit distinct developments, potentially securing substantial profits after being all in on QQQ from January to September. Naturally, various hedge vehicles were involved, including foreign exchange.

The primary and most evident factor was the BDI, reflecting trade shipping. I emphasized that this involved colossal vessels transporting the most substantial commodities, not just small-scale shipping or seasonal trade like Thanksgiving or Christmas. Reflecting on the 2000s, there was a surge in vessel supply due to a trade boom. However, after the 2008 Global Financial Crisis, when tensions escalated between the US and China, the surplus vessels led to corrosion, sinking, and bankruptcies among global shipping companies. Looking 15 years later, what if the US and China successfully rekindle their global trade? We might face a shortage of vessels. What concerns me is how we can address the threat of inflation when we lack sufficient sea infrastructure.

The ongoing rebound in China and the global shift towards more growth and sustainable energy has significantly fueled my October thesis on Iron Ore and Copper. It’s important to note that future performance is not guaranteed by past or current trends, but there is a possibility that they may continue to follow a similar rhythm.

Imagine no possessions
I wonder if you can
No need for greed or hunger
A brotherhood of man

Again, you might say I am a dreamer, but I will continue to dream of world peace, prioritizing it above any financial gain or profits I have made or could potentially make from the pursuit of peace.

Please note that all ideas expressed in this blog and website are solely my personal opinions and should not be considered as financial advice.

Heal The World

There comes a time when we heed a CERTAIN CALL
When the world must come together as one
The greatest gift of all

If a dead cross occurs in $DXY, we might see it drop to 101, with a further possibility of reaching 96. It’s possible that people underestimate the impact of $DXY falling to 96, which may cause very high inflation to the world. In line with my previous article, there’s a substantial effect backlog of money accumulated over the past decade of quantitative easing, which I’ve been observing for the past 5 years.

I believe the $DXY dead-cross possibility might be linked to the outcome of the US China restoration progress, determining whether they can successfully address their decades-long issues. Few people are aware of the extent of potential from the restoration. I will continue to monitor the situation over time.

I suspect that bringing China’s rebound into reality is crucial, especially considering that the Bank of Japan and Europe have continuously been reaching their limits and are beginning to shift their policies. China would require USD to facilitate their easing and rebound, and the US needs China to absorb a portion of the inflation that could impact their economic systems. This collaboration could reduce the severity of USD easing, support long-term debt, and revive their long-lost long-term economic vehicles. Although differences (e.g. Taiwan and South China Sea) may continue to persist, the economic dynamics of the old days could bring peace to the world through the bond between the two largest economies.

I am still focusing on the magnificent seven and specific commodities to be my top picks, mainly ones with strong financial supports, and I may rather want to elevate these to another higher level. The commodities still remains largest (>90%) since early October as explained in here and here. There is a high potential for a massive bull flag from the magnificent seven, supported by a strong positive divergence and a rare golden cross in the premium area. This suggests that a very strong force is currently in the making. My primary reasons for the elevation are:

  • My own thesis since September, the Fed has concluded its rate increases. Another rate hike would only unnecessarily bring down the entire market while navigating short-term turbulence of inflation.
  • Recent change in Treasury issuance distribution.
  • Lower official inflation number. If the real inflation in the market is higher and it suggests/conditions unchanged or lower interest rate, current rate may be perceived as effectively too low, potentially only supporting further market easing condition.


Even though I suspect there will be some kind of deal and control over Iron Ore to prevent it from spiralling out of control further, this price of $130 may likely already offer one of the decade’s very high profit margins, supported by the current AUDUSD situation.

I’m not particularly concerned about the interest growth from the existing debt in the US. It is consistently refinanced internally, so the additional interest in the next 1-2 years is not substantial, perhaps around only 200-300 billion US dollars per year. The recent Treasury decision to shift their distribution from more bonds to more bills suggests that they may have struck a new deal, limit or made a decision to support risk assets. I would not be surprised if the Fed is also willing to provide additional support with a reduced Quantitative Tightening (QT). However, as indicated in an article from a few months ago, the Fed might be hesitant to take such action.

I suspect that a significant amount in the Treasury General Account (TGA) is also likely offering ample reassurance to both my mindset and the decision-makers among global leaders, disregarding debates about the appropriate levels of Reverse Repurchase Agreements (RRP) and reserves within the systems.

The amount of debt interest can also easily decrease if the Fed decides to cut the interest rate. However, I suspect that the economy will remain robust for a much longer period, especially with the emergence of a new potential cooperated economy, and the lower USD is likely to persist for an extended duration. Of course, the possibility of a recession, hard-landing, and a soft-landing, all still exists. Currently, I maintain an optimistic outlook and stay vigilant in monitoring its progress. In my opinion, a recession and a hard landing, during a robust economy, simply hold no sway against the sheer power of a lower denominator USD.

I observe similar indications with $TLT. It demonstrates a high potential for positive divergence across the bottom of wave 3. If $TLT establishes a golden cross and breaks the bottom of (3), there is a strong possibility of it becoming the long-awaited number (5). Although I’m still not actively participating in long bonds, I view this as an indicator of much fewer issues for a risky asset rally.

Over the past four decades, I have lived and studied emerging countries and have witnessed numerous attempts to manipulate their economic data, particularly regarding inflation. Between 2010 and 2015, there was a notable instance where a country experienced housing inflation of over 100% within five years, yet officially reported an inflation rate of 0.07% year on year, resulting in a memorable laughable moment among economists. They couldn’t be more serious because, coincidentally, it was announced at the same time as the release of one of James Bond 007 movie series. I believe that official economic figures are considered a matter of national security, especially concerning national debt purchases, leading to the routine practice of re-engineering these numbers.

Whether one likes it or not, a persistent weaker currency strength is a fundamental indicator of higher inflation. Inflation is heightened due to limited resources. Over the past 10 years, when the AUDUSD dropped by 36%, we witnessed a massive increase in prices, yet the official inflation numbers remain relatively low. The inflation of certain products does not need to occur immediately; it may take a number of years and varies among different products. However, the impact is obviously inevitable. Hence, to mitigate their impact or conceal them from economic activity, a stable pairing with other countries is necessary, while losing value.

A few years back, it was only a portion of the price. A significant contribution may come from the higher property rental economy, which is not allowed to significantly correct.

To bolster my scepticism, we can readily observe substantial inflation in everyday consumer spending, even as the official inflation rate remains lower, irrespective of any debate over their respective weights. In environments characterized by high inflation, it is common to employ special treatments to compensate for losses indicated by the inflation numbers. In my personal theory and observation, during such times, these numbers are often re-engineered to align with the legal aspects of the deal. Typically within the high echelons of official ranks.

In summary, in my opinion, we should distinguish between a high-quality rally and less quality one. The QQQ performance in H1 2023 impressed me significantly, especially because they were rallying with a stronger USD currency. A current rally with a weaker currency does not impress me as much, as even an item like a ham and cheese croissant can experience multiple price rallies. It is much easier to drive up asset prices by simply devaluing the currency. However, regardless, a rally is still a rally, and hope to continue into Christmas.

There’s a place in your heart
And I know that it is love
And this place could be much
Brighter than tomorrow

Please note that all ideas expressed in this blog and website are solely my personal opinions and should not be considered as financial advice.

Economic War

War does not determine who is right – only who is left – Bertrand Russell

I’ll begin with my own speculative theory (an unverified assertion) regarding the decoupling of the United States and China. Prior to the Global Financial Crisis of 2008, China reinvested the proceeds from their exports into the United States. The crisis in 2008 disrupted their financial relationship due to reckless money management. We may recall the substantial losses suffered by a Norwegian investor in the U.S. mortgage market. Following the 2008 crisis, there was a mutual lack of confidence between them in managing financial resources. To illustrate this simply, let’s imagine they initially had built up $30 of mutual trust in terms of financial investments.

Now, let’s assume that $20 of this trust is dissipating due to this lack of confidence. In response, each of their respective central banks had to generate $20 (and of course some extra greedy money) to inject liquidity into the funds that were leaving the mutual investments.

Subsequently, the global economy was left with an additional $40 in liquidity (2 times the initial $20). The other $20 would likely gravitate towards a more supportive U.S. economic policy and a greater role as a global reserve currency, adding another extra liquidity on top of some extra and extra. Meanwhile, China would have to continue with monetary easing measures to compensate for the $20 exiting their systems and combating massive amount of real estate deleverage. This issue is further compounded with Emerging Market sensitivity issue to inflation. Notice the difference.

I’m working to navigate my current top fantastic four investment lieutenants within the context of the economic war dynamic and extra liquidity movement:

  • QQQ (Sustainable Energy and Artificial Intelligence)
  • Commodity (Copper and Iron Ore)
  • The Bill and The Bond
  • Property

Over the past year, we have scaled back massively on our investments in Property, and Bonds for various reasons. This has led us to engage in more active hands-on combat management between our holdings in QQQ and Commodities. It’s important to remember that each individual has their own unique circumstances and investment strategy, so what works for me may not be suitable for everyone.

In a December 2021, we accurately abstained from taking any positions in QQQ (after it was driven by too much extra liquidity) and correctly predicted the onset of high inflation. Inflation means there is too much extra money than economy can absorb in the foreseeable future. In my opinion is due to too much and long near zero rate easing and the decoupling money. Take note of the correlation between QQQ, liquidity, and inflation, regardless of which one is the cause. Six months later, due to the looming threat of high inflation, the Federal Reserve had to implement the fastest rate hike in history.

In a January 2023, we made a precise reallocation, moving nearly all of our commodity holdings and one-third of our property holdings into QQQ with substantial leverage. We believe it is excessively oversold and undervalued given the amount of available liquidity at that time. Our preference was towards the advancements in sustainable energy and Artificial Intelligence (AI).

Moving ahead to September 2023 and very early October 2023, in our current portfolio strategy, we decided to shift all of our QQQ holdings back into commodities (at a 15% discount) due to the following reasons:

  1. QQQ appeared way overvalued based on both fundamental and technical analysis. In the September article, we strongly believe that the Fed has completed the rate hike at 5.25-5.5%, indicating that there is less likely additional liquidity to fuel much further impressive QQQ rally. Of course, we both understand that there is still about 1 trillion dollars in RRP (Reverse Repurchase Agreement) and 1 trillion dollars in bank reserves in the ecosystem, which can have various unintended effects. We are also uncertain about how far the US and China will resolve their mutual trust and economic trade barrier issues, which could potentially provide additional momentum to QQQ.
  2. Previously (early October 2023) we held the theory that the U.S. 10-year Treasury yield at 4.2-4.7% was too low while other economists at that time believed it had peaked. Shortly after, there was a rally in the 10-year yield to near and above 5%. A rally in the U.S. 10-year yield may also indicate something is less supporting QQQ.
  3. However in my opinion, the rally in the US 10-year Treasury yield may indicate something is supporting commodities. While the prevailing common view attributes it to potential supply, I would like to consider it from this context, the perspective of China. Commodity positions seemed more appealing, especially given (in my own belief, others may disagree) the increased cooperation between the U.S. and China, following with higher economy activity in China, and may cause some degree of higher consumer price inflation in future.
  4. Due to that reasoning, also, on October 6th, 2023, we initially theorized that consumer-related inflation (CPI and PPI) might begin to show signs of a rebound, while others believed they would continue trending lower. Shortly after on October 11th, both CPI and PPI indeed indicated an initial rebound, and the US 10-year Treasury yield continued their rally from 4.2-4.7% to 5%. While people commonly attribute this to China exporting inflation, in my opinion, it’s due to the Chinese economy, which has undergone tightening over the past three years, suddenly consuming more resources and exporting more. If this is indeed the case, it should drive consumer prices higher.

Our top two picks in commodities are copper and iron ore, as we believe these two materials have the highest volume in economic growth and renewable evolution. Please note that we are not endorsing direct investment in commodities, ETF, or any specific stocks or investment vehicles. We leave that to the financial advisor. Our purpose here is to focus solely on discussing the thesis and theory that can closely predict the future and not according to popular opinion.

From our perspective, iron ore continues to be an attractive prospect considering its favourable price and substantial volume. If the current volume keeps increasing, the unit cost could potentially dip below $20. Furthermore, when factoring in the Australian Dollar (AUD) sale cost, it logically provides a 22% higher profit margin.

As for graphite and rare earth, we have reservations due to:

  • A high level of uncertainty regarding their production and market control.
  • Limited profit margins.

Regarding lithium, we are cautious due to its price volatility, which presents a higher risk to our risk management. In fact, we believe that the current price of lithium is still overvalued after the recent “tulip mania” event, similar to the situation with copper after the technology boom in the year 2000, and it may take a few more years to normalize.

We are still navigating a very complex yield curve dynamic and its associated liquidity challenges. However, as indicated in a previous article, we would like to concentrate on the short-term US10Y. Our position in commodities is also influenced by our suspicion that there will be a continuing imminent shift in $TNX, backed by the just recent more stability of $TLT.

What do we think will happen IF the U.S. and China had real issues in the past and are now genuinely moving towards better economic cooperation? Would there be better resolution of US liquidity? Would there be increased of commodity consumption? Would there be higher consumer price? We leave that up to each individual’s superpower skill, imagination, and portfolio strategy.

The outcome of a global economic war is not a measure of which side was morally or ethically justified in their cause. Instead, it emphasizes that the side with superior resources, and strategic advantage often emerges as the victor, rather than the righteousness of a particular cause. Furthermore, the phrase highlights the tragic and devastating toll that war takes on both sides, leading to high inflation, high mortgage rate, costly living cost, volatility and investment loss. Overall, this saying underscores the futility of resolving complex economy issues and encourages the pursuit of alternative means, such as diplomacy and dialogue, to achieve lasting and just solutions.

Please note that all ideas expressed in this blog and website are solely my personal opinions and should not be considered as financial advice.

Acceptance of The Inevitable

“When the fierce, burning winds blow over our lives-and we cannot prevent them-let us, too, accept the inevitable. And then get busy and pick up the pieces.”

Dale Carnegie – Stop Worrying and Start Living.

In my previous articles, I have argued that current economic systems should accommodate a 5.5% growth. This is a straightforward concept, and I would employ 5.5% as the fundamental standard throughout my entire thesis. Since 2020, the US debt has been consistently increasing at the same rate of 5.5%. I anticipate this trend to continue until next few years, at which point after, it may accelerate even further faster. Unless the largest economy in the US experiences a significant deviation from its trends spanning decades, we should acknowledge my inevitable economic thesis: (1) higher debt (2) faster debt, coined as “higher further faster.”

The current pace of growth has exceeded that of the previous cycle and is anticipated to rise further in the subsequent cycle (after the next Global Financial Crisis). During this period, the global landscape has been notably demanding due to elevated levels of debt growth. The earlier 2020 CoVID crisis necessitated low interest rates and fiscal support measures to steer it back onto its 5.5% trajectory. I would anticipate policymakers to maintain their commitment to this debt-driven growth. Ultimately, they would have little choice but to align with this trend, lest they risk jeopardizing the entire economic framework, which amounts to hundreds of trillions in human history.

In prior articles, I contended that a 5.5% increase in debt might lead to significant economic challenges:

  • Firstly, a 5.5% increase in debt will drive asset growth at a rate of at least 5.5%. This will lead to a swifter expansion of assets in the market and among participants. We can anticipate the following:
    • Wealthy individuals with significant assets will experience even greater wealth accumulation.
    • Major corporations will demonstrate resilience, maintaining stable revenues and continued hiring.
  • Secondly, historically, wage growth has not exceeded 5.5%. This could pose a challenge as most workers may struggle to keep pace with inflation.
  • Thirdly, individuals fortunate enough to possess substantial and rapidly appreciating assets may face a decision between continuing employment or opting for retirement. I suspect this may be a minor contributor to the lower unemployment rate, owing to workers choosing earlier retirement. Over time, they are likely to receive enduring support with returns sustaining at 5.5%.
  • Lastly, there should be an adjustment in yields. Assuming policymakers remain steadfast, I would contend that long-term yields should at least approach 5.5%.

We are witnessing evidence supporting my fourth argument here. Over the past few weeks, we have observed disruptions in both $TLT and $TNX. I stand by my thesis that they should reach a minimum of 5.5%, and possibly even higher on the longer end. While some economists have been suggesting that TLT may have hit its bottom in the past few weeks, I would argue that it has not yet done so. The 10-year yield has not yet reached 5.5%. I firmly believe that the 10-year yield is strongly linked with inflation. Therefore, given that the 10-year yield has surpassed its previous high of 4.2%, we should anticipate:

  1. A prevailing narrative of heightened inflation.
  2. A new normal of 5.5%.

I suspect that this shift in narrative, which has taken us halfway through the cycle, where we’re beginning to see a rise in both inflation and yield, has contributed to the recent bout of volatility. From my perspective, policymakers are standing firm in their commitment to achieve a 5.5% growth through a combination of deficit spending and monetary measures. It’s worth noting that not all economists endorse these policies, with some deeming them as risky due to their potential to excessively stimulate the near term, possibly jeopardizing the long term.

I contend that the world has entered a new paradigm, and in my view, 5.5% represents a new normal. Market participants should be prepared to embrace this change and acknowledge its inevitability.

However, it’s important to recognize that this acceptance is not without repercussions, as elucidated in my second and third arguments. While major corporations continue to generate substantial profits, the same cannot be said for smaller enterprises and the average individual. Unless wage growth experiences a substantial acceleration, we may continue to face challenges in the market. We must closely monitor whether individuals can sustain their spending, if major company revenues will continue to surge, or essentially, if key economic indicators will remain robust.

I understand that some advocate for a focus on the average economy. Yet, in my perspective, policy tends to lean towards the larger economic landscape rather than the average. If these significant economic indicators were to falter — for instance, if major corporations were to significantly reduce employment — the new ecosystems might face difficulties. However, as we have observed, the major economic metrics remain solid. Therefore, in my view, policymakers will stay the course, using front-end deficit measures.

Given the stability in economic metrics, I don’t see any reason for policymakers to alter their approach until long-term yields reach a 5.5% growth (which has not yet been achieved). I believe they will remain steadfast in their strategy and avoid making significant disruptions to the long term until this 5.5% objective is met.

I maintain my thesis that a 5.5% front-end Fed rate represents the peak or upper limit for the Fed rate. As of August 2023, this remains my peak rate thesis. My argument is straightforward and is rooted in the observed debt growth. Raising the rate beyond 5.5% would likely lead to a stagnation in the economy and a contraction in liquidity, thereby tightening the market. Conversely, reducing the rate below 5.5% would likely only spur inflation, which has been trending upwards over the past half of the cycle. The longer policymakers adhere to a 5.5% rate in the front end, through the use of fiscal deficit, the more entrenched it will become in the long end.

There is a discussion surrounding the potential limitations of fiscal deficit supply. If over the next 4-5 years we do not observe any improvement in market resilience, we may unfortunately face a significant new challenge where increasing long-term yields could escalate beyond control. My contention is that supply allocation should no longer disproportionately favor short durations and must begin to exert pressure on longer durations. In this scenario, Treasury buybacks (which would be implemented gradually starting in 2024) could emerge as a dominant policy to prevent an uncontrolled surge in long-term yields, which the global economy may not be able to sustain. We’ll deal with this later.

To avert such a situation, as I argued in my articles over the past two months, cooperation with other countries, particularly China, should improve. I still believe that China has not yet substantially reduced its holdings of US Treasuries. There will be debates regarding duration and potential reallocation, possibly involving Europe.

In contrast to some other economists who may anticipate a cooling down of inflation, I adhere to my thesis that we will start to witness a resurgence of inflation, and it will likely persist at elevated levels. This is why I have begun to reacquire quite significant amount of leveraged commodities. In the next few years, I anticipate a potential (restrictive) cycle in commodity growth. I cannot predict whether there will be a definite recession next year. We should closely monitor the global market’s resilience during this period.

Given the considerations above, and in light of the increased yields’ impact on resilience, we have decided to re-enter the market, albeit without employing much leverage. In previous years, we consistently maintained leverage ranging from 200% to 300%. However, for this half of the cycle, we are beginning to allocate a portion of our previous leverage into fixed incomes (though not yet long-term bonds), and we have not yet introduced significant leverage. If long-term yields were to surge above the 5.5% trend, I may then reallocate fixed incomes into long-term bonds. I believe it is a prudent decision to introduce fixed income into my portfolio, which has primarily consisted of high-risk assets with high leverage in the past 3-4 years, lacking lower-risk assets.

Please note that all ideas expressed in this blog and website are solely my personal opinions and should not be considered as financial advice.